

Linux调试器-gdb使用
| 阿里云国内75折 回扣 微信号:monov8 |
| 阿里云国际,腾讯云国际,低至75折。AWS 93折 免费开户实名账号 代冲值 优惠多多 微信号:monov8 飞机:@monov6 |
目录
调试器核心工作主要是为了定位问题
所有查看的指令不影响实际的调试指令
1. 背景
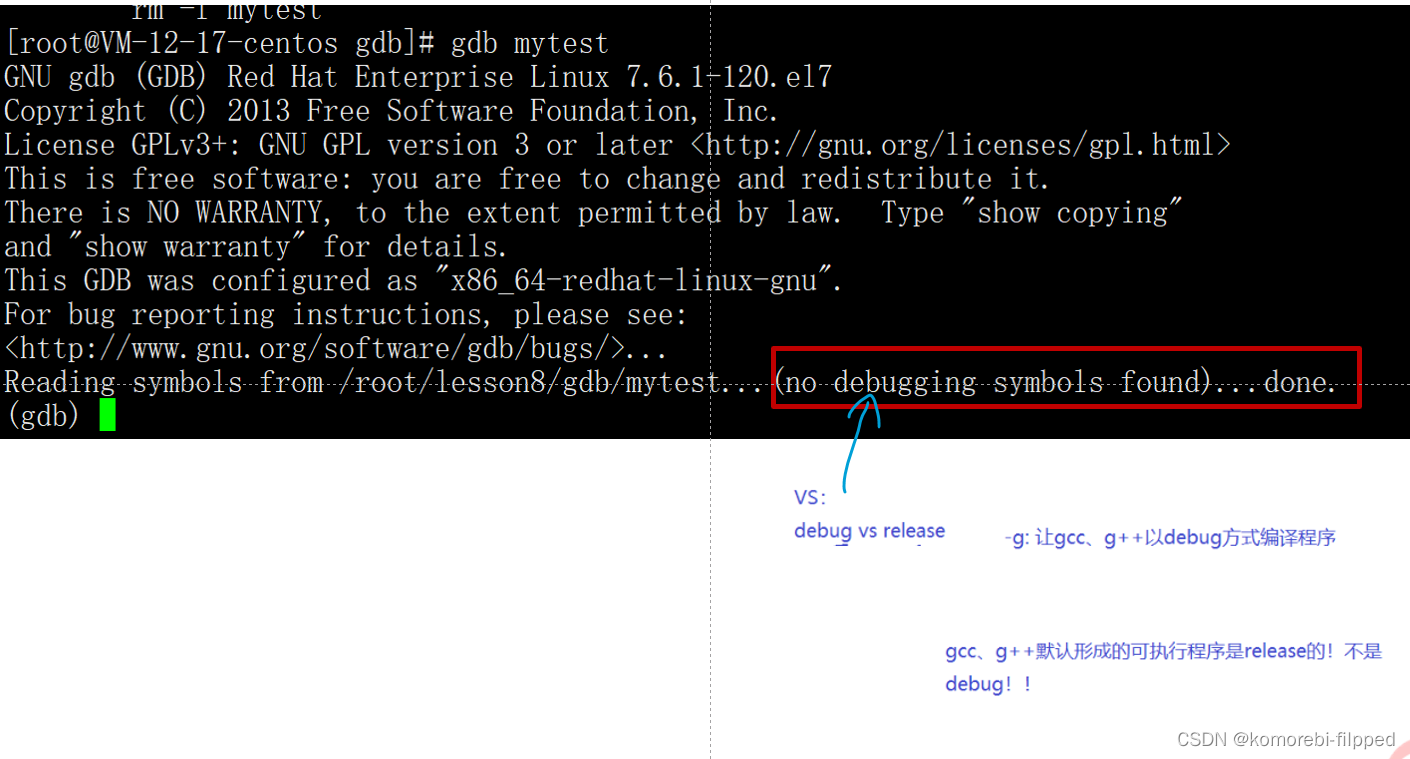
程序的发布方式有两种debug模式和release模式Linux gcc/g++出来的二进制程序默认是release模式要使用gdb调试必须在源代码生成二进制程序的时候, 加上 -g 选项
2. 开始使用
- gdb binFile 退出 ctrl + d 或 quit 调试命令
- list/l 行号显示binFile源代码接着上次的位置往下列每次列10行。
- list/l 函数名列出某个函数的源代码。
- r或run运行程序。
- n 或 next单条执行。
- s或step进入函数调用
- break(b) 行号在某一行设置断点
- break 函数名在某个函数开头设置断点
- info break 查看断点信息。
- finish执行到当前函数返回然后挺下来等待命令
- print(p)打印表达式的值通过表达式可以修改变量的值或者调用函数
- p 变量打印变量值。
- set var修改变量的值
- continue(或c)从当前位置开始连续而非单步执行程序
- run(或r)从开始连续而非单步执行程序
- delete breakpoints删除所有断点
- delete breakpoints n删除序号为n的断点
- disable breakpoints禁用断点
- enable breakpoints启用断点
- info(或i) breakpoints参看当前设置了哪些断点
- display 变量名跟踪查看一个变量每次停下来都显示它的值
- undisplay取消对先前设置的那些变量的跟踪
- until X行号跳至X行
- breaktrace(或bt)查看各级函数调用及参数
- infoi) locals查看当前栈帧局部变量的值
- quit退出gdb
3. 理解
创建需要调试的代码
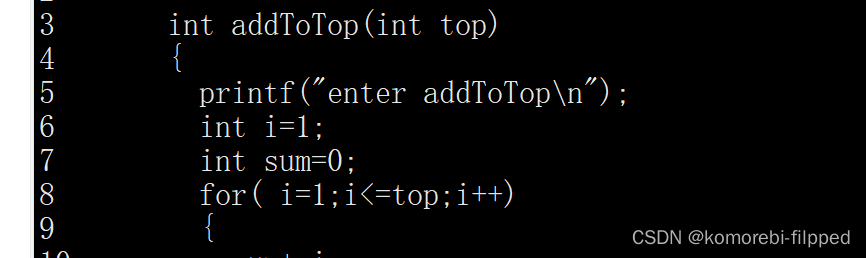
[root@VM-12-17-centos lesson8]# mkdir gdb
[root@VM-12-17-centos lesson8]# cd gdb
[root@VM-12-17-centos gdb]# touch test.c
[root@VM-12-17-centos gdb]# ll
total 0
-rw-r--r-- 1 root root 0 Jan 17 19:39 test.c
[root@VM-12-17-centos gdb]# ls ../
gdb  Makefile  mytest  proc  test.c
[root@VM-12-17-centos gdb]# cp ../Makefile .
[root@VM-12-17-centos gdb]# ll
total 4
-rw-r--r-- 1 root root 71 Jan 17 19:40 Makefile
-rw-r--r-- 1 root root  0 Jan 17 19:39 test.c
[root@VM-12-17-centos gdb]# vim test.c
[root@VM-12-17-centos gdb]# cat test.c
#include <stdio.h>

int addToTop(int top)
{
  printf("enter addToTop\n");
  int i=1;
  int sum=0;
  for( i=1;i<=top;i++)
  {
    sum+=i;

  }
  printf("quit addToTop\n");
  return sum;
}


int main()
{
  int top=100;

  int result=addToTop(top);
  printf("result:%d\n",result);
  return 0;
}
[root@VM-12-17-centos gdb]# cat Makefile
mytest:test.c
	gcc -o mytest test.c -std=c99

.PHONY:clean
clean:
	rm -f mytest
[root@VM-12-17-centos gdb]# ll
total 8
-rw-r--r-- 1 root root  71 Jan 17 19:40 Makefile
-rw-r--r-- 1 root root 285 Jan 17 19:45 test.c
[root@VM-12-17-centos gdb]# vim Makefile
[root@VM-12-17-centos gdb]# make
gcc -o mytest test.c
test.c: In function ‘addToTop’:
test.c:8:3: error: ‘for’ loop initial declarations are only allowed in C99 mode
   for(int i=1;i<=top;i++)
   ^
test.c:8:3: note: use option -std=c99 or -std=gnu99 to compile your code
make: *** [mytest] Error 1
如果出现这种报错该语法在C99标准下被支持在Makefile内添加-std=c99
mytest:test.c
     gcc -o mytest test.c -std=c99

   .PHONY:clean
   clean:
     rm -f mytest
debug&&release
我们对之前生成的mytest重命名使我们观察的现象更明显
[root@VM-12-17-centos gdb]# mv mytest mytest-release
[root@VM-12-17-centos gdb]# ll
total 20
-rw-r--r-- 1 root root   83 Jan 17 20:12 Makefile
-rwxr-xr-x 1 root root 8440 Jan 17 19:49 mytest-release
-rw-r--r-- 1 root root  292 Jan 17 19:49 test.c
[root@VM-12-17-centos gdb]# ./mytest-release
enter addToTop
quit addToTop
result:5050
我们生成debug方式编译的文件
[root@VM-12-17-centos gdb]# make
gcc -o mytest test.c -g -std=c99
[root@VM-12-17-centos gdb]# ll
total 32
-rw-r--r-- 1 root root   83 Jan 17 20:12 Makefile
-rwxr-xr-x 1 root root 9672 Jan 17 20:18 mytest
-rwxr-xr-x 1 root root 8440 Jan 17 19:49 mytest-release
-rw-r--r-- 1 root root  292 Jan 17 19:49 test.c
[root@VM-12-17-centos gdb]# mv mytest mytest-debug
[root@VM-12-17-centos gdb]# ll
total 32
-rw-r--r-- 1 root root   83 Jan 17 20:12 Makefile
-rwxr-xr-x 1 root root 9672 Jan 17 20:18 mytest-debug
-rwxr-xr-x 1 root root 8440 Jan 17 19:49 mytest-release
-rw-r--r-- 1 root root  292 Jan 17 19:49 test.c
[root@VM-12-17-centos gdb]# ./mytest-debug
enter addToTop
quit addToTop
result:5050
release、debug都能正常运行
debug版本内有很多的调试信息其体积比release版本大
[root@VM-12-17-centos gdb]# readelf -S mytest-debug | grep -i debug
  [27] .debug_aranges    PROGBITS         0000000000000000  00001069
  [28] .debug_info       PROGBITS         0000000000000000  00001099
  [29] .debug_abbrev     PROGBITS         0000000000000000  00001191
  [30] .debug_line       PROGBITS         0000000000000000  0000121c
  [31] .debug_str        PROGBITS         0000000000000000  00001273
[root@VM-12-17-centos gdb]# readelf -S mytest-release | grep -i debug
[root@VM-12-17-centos gdb]#

4 详细调试
list/l 行号
显示binFile源代码接着上次的位置往下列每次列10行。
[root@VM-12-17-centos gdb]# gdb mytest-debug
GNU gdb (GDB) Red Hat Enterprise Linux 7.6.1-120.el7
Copyright (C) 2013 Free Software Foundation, Inc.
License GPLv3+: GNU GPL version 3 or later <http://gnu.org/licenses/gpl.html>
This is free software: you are free to change and redistribute it.
There is NO WARRANTY, to the extent permitted by law.  Type "show copying"
and "show warranty" for details.
This GDB was configured as "x86_64-redhat-linux-gnu".
For bug reporting instructions, please see:
<http://www.gnu.org/software/gdb/bugs/>...
Reading symbols from /root/lesson8/gdb/mytest-debug...done.
(gdb) l
11
12	  }
13	  printf("quit addToTop\n");
14	  return sum;
15	}
16
17
18	int main()
19	{
20	  int top=100;
(gdb) l 0
1	#include <stdio.h>
2
3	int addToTop(int top)
4	{
5	  printf("enter addToTop\n");
6	  int i=1;
7	  int sum=0;
8	  for( i=1;i<=top;i++)
9	  {
10	    sum+=i;
(gdb) l
11
12	  }
13	  printf("quit addToTop\n");
14	  return sum;
15	}
16
17
18	int main()
19	{
20	  int top=100;
(gdb) l
21
22	  int result=addToTop(top);
23	  printf("result:%d\n",result);
24	  return 0;
25	}
(gdb) l
Line number 26 out of range; test.c has 25 lines.
(gdb)
list/l 函数名
列出某个函数的源代码函数名居中(gdb) l main 14 return sum; 15 } 16 17 18 int main() 19 { 20 int top=100; 21 22 int result=addToTop(top); 23 printf("result:%d\n",result);
r或run
运行程序
(gdb) r
Starting program: /root/lesson8/gdb/mytest-debug
enter addToTop
quit addToTop
result:5050
[Inferior 1 (process 480) exited normally]
break(b)
插入断点
(gdb) b 19
Breakpoint 1 at 0x4005d2: file test.c, line 19.
info b(reak)
查看断点信息
(gdb) info b
Num     Type           Disp Enb Address            What
1       breakpoint     keep y   0x00000000004005d2 in main at test.c:19
(gdb) r
Starting program: /root/lesson8/gdb/mytest-debug

Breakpoint 1, main () at test.c:20
20	  int top=100;
(gdb) info b
Num     Type           Disp Enb Address            What
1       breakpoint     keep y   0x00000000004005d2 in main at test.c:19
	breakpoint already hit 1 time
d num
删除断点num是断点的序号
(gdb) d 19
No breakpoint number 19.
(gdb) d 1
(gdb) info b
No breakpoints or watchpoints.
(gdb) b 19 Breakpoint 2 at 0x4005d2: file test.c, line 19. (gdb) r Starting program: /root/lesson8/gdb/mytest-debug Breakpoint 2, main () at test.c:20 20 int top=100; (gdb) info b Num Type Disp Enb Address What 2 breakpoint keep y 0x00000000004005d2 in main at test.c:19 breakpoint already hit 1 time我们重新设置断点然后发现当我们还未退出这一次gdb时我们即便删除之前的断点我们重新设置的断点的num会增加这里提一个功能就是打开/关闭断点我们看到enb下是yes说明该断点是打开的尤其是当我们不确定代码哪里出现问题我们设置多个但是不一定同时使用的断点时num的递增计数方式及断点的打开/关闭结合的功能会很好地帮助我们解决问题。
disable breakpoints
禁用断点(gdb) disable breakpoint 2 (gdb) info b Num Type Disp Enb Address What 2 breakpoint keep n 0x00000000004005d2 in main at test.c:19 breakpoint already hit 1 time (gdb) r The program being debugged has been started already. Start it from the beginning? (y or n) y Starting program: /root/lesson8/gdb/mytest-debug enter addToTop quit addToTop result:5050 [Inferior 1 (process 4066) exited normally]
enable breakpoints
启用断点(gdb) enable breakpoint 3 (gdb) info b Num Type Disp Enb Address What 3 breakpoint keep y 0x00000000004005d2 in main at test.c:19
n (next)
逐过程
(gdb) r
Starting program: /root/lesson8/gdb/mytest-debug

Breakpoint 1, main () at test.c:20
20	  int top=100;
Missing separate debuginfos, use: debuginfo-install glibc-2.17-326.el7_9.x86_64
(gdb) n
22	  int result=addToTop(top);
(gdb) n
enter addToTop
quit addToTop
23	  printf("result:%d\n",result);
(gdb) l 22
17
18	int main()
19	{
20	  int top=100;
21
22	  int result=addToTop(top);
23	  printf("result:%d\n",result);
24	  return 0;
25	}
(gdb)
Line number 26 out of range; test.c has 25 lines.
(gdb) n
result:5050
24	  return 0;
(gdb) n
25	}
(gdb) n
0x00007ffff7a2f555 in __libc_start_main () from /lib64/libc.so.6
sstep
逐语句
(gdb) b 22
Breakpoint 2 at 0x4005d9: file test.c, line 22.
(gdb) d 1
(gdb) r
The program being debugged has been started already.
Start it from the beginning? (y or n) y
Starting program: /root/lesson8/gdb/mytest-debug

Breakpoint 2, main () at test.c:22
22	  int result=addToTop(top);
(gdb) s
addToTop (top=100) at test.c:5
5	  printf("enter addToTop\n");
调用函数实现压栈的过程main函数在栈底addToTop在其之上
breaktrace(或bt)
查看各级函数调用及参数
p 变量
打印变量值
(gdb) p sum
$1 = 3
(gdb) p i
$2 = 2
(gdb) p &sum
$3 = (int *) 0x7fffffffe438
(gdb) p &i
$4 = (int *) 0x7fffffffe43c
但是要一次一次地显示非常麻烦
display 变量名
常显示(内置类型结构体等自定义类型stl
跟踪查看一个变量每次停下来都显示它的值
(gdb) display sum
1: sum = 3
(gdb) display i
2: i = 2
(gdb) display &sum
3: &sum = (int *) 0x7fffffffe438
(gdb) display &i
4: &i = (int *) 0x7fffffffe43c
(gdb) s
10	    sum+=i;
4: &i = (int *) 0x7fffffffe43c
3: &sum = (int *) 0x7fffffffe438
2: i = 3
1: sum = 3
(gdb) s
8	  for( i=1;i<=top;i++)
4: &i = (int *) 0x7fffffffe43c
3: &sum = (int *) 0x7fffffffe438
2: i = 3
1: sum = 6
undisplay
取消对先前设置的那些变量的跟踪
(gdb) s
8	  for( i=1;i<=top;i++)
4: &i = (int *) 0x7fffffffe43c
3: &sum = (int *) 0x7fffffffe438
2: i = 3
1: sum = 6
(gdb) undisplay &sum
warning: bad display number at or near '&sum'
(gdb) undisplay 3
(gdb) n
10	    sum+=i;
4: &i = (int *) 0x7fffffffe43c
2: i = 4
1: sum = 6
until X行号
跳至X行,执行完区间代码
(gdb) l 0
1	#include <stdio.h>
2
3	int addToTop(int top)
4	{
5	  printf("enter addToTop\n");
6	  int i=1;
7	  int sum=0;
8	  for( i=1;i<=top;i++)
9	  {
10	    sum+=i;
(gdb) l
11
12	  }
13	  printf("quit addToTop\n");
14	  return sum;
15	}
16
17
18	int main()
19	{
20	  int top=100;
(gdb) until 13
addToTop (top=100) at test.c:13
13	  printf("quit addToTop\n");
4: &i = (int *) 0x7fffffffe43c
2: i = 101
1: sum = 5050
finish
执行到当前函数返回然后停下来等待命令
(gdb) finish
Run till exit from #0  addToTop (top=100) at test.c:7
quit addToTop
0x00000000004005e3 in main () at test.c:22
22	  int result=addToTop(top);
Value returned is $5 = 5050
(gdb) n
23	  printf("result:%d\n",result);
(gdb) p result
$6 = 5050
c
从一个 断点处直接运行至下一个断点处
(gdb) r
The program being debugged has been started already.
Start it from the beginning? (y or n) y
Starting program: /root/lesson8/gdb/mytest-debug

Breakpoint 3, main () at test.c:20
20	  int top=100;
(gdb) c
Continuing.

Breakpoint 2, main () at test.c:22
22	  int result=addToTop(top);