

Windows安装Logstash
| 阿里云国内75折 回扣 微信号:monov8 |
| 阿里云国际,腾讯云国际,低至75折。AWS 93折 免费开户实名账号 代冲值 优惠多多 微信号:monov8 飞机:@monov6 |
Logstash官网地址
Logstash下载地址
Logstash 配置语法
Logstash Input plugins输入插件
Logstash是 Elastic Stack 的中央数据流引擎数据收集引擎用于收集、丰富和统一所有数据而不管格式或模式。当Logstash与ElasticsearchKibana及 Beats 共同使用的时候便会拥有特别强大的实时处理能力(ELK)。
Logstash包含3个主要部分
input(输入)必须负责产生事件Inputs generate events采集各种样式大小和相关来源数据从各个服务器中收集数据常用stdin用于调试、file、syslog、redis、kafka、beatsfilebeat类型。
filters(过滤器)可选负责数据处理与转换filters modify them常用grok、mutate、drop、clone、geoip
outputs(输出)必须负责数据输出outputs ship them elsewhere将我们过滤出的数据保存到那些数据库和相关存储中常用elasticsearch、file、graphite、statsd
1、安装准备
Logstash是基于java语言开发依赖于JDK所以先安装JDK
2、进入bin目录新建文件【logstash.conf】文件代码如下
input {
    stdin{
    }
}

output {
    stdout{
    }
}
3、检查配置文件是否正确
打开文件夹地址栏切换到【bin】目录输入【cmd】回车命令行输入命令
logstash -f logstash.conf -t提示【Configuration OK】表示成功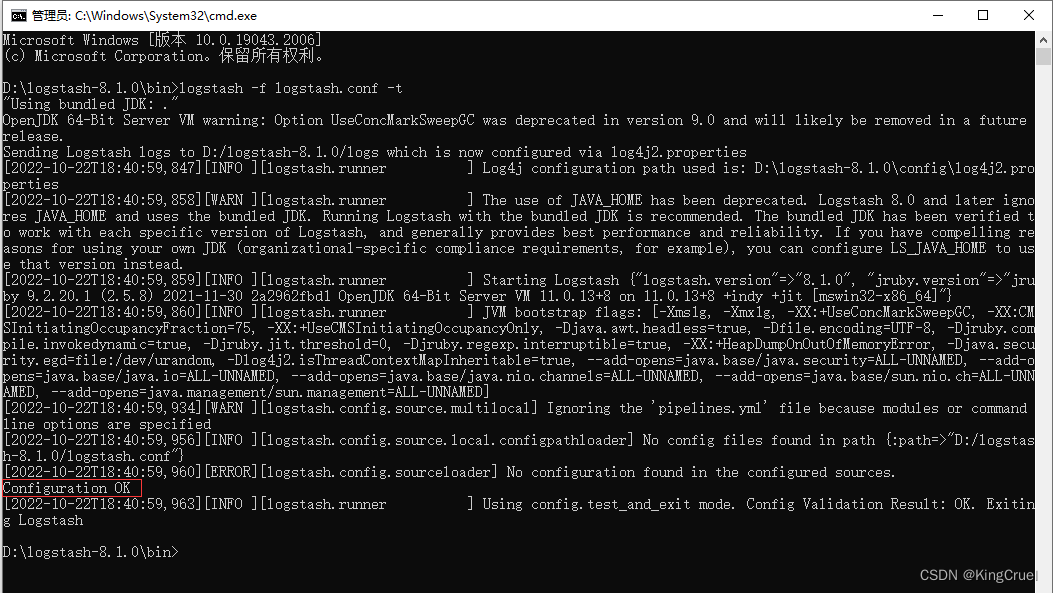
4、启动 Logstash
打开文件夹地址栏切换到【bin】目录输入【cmd】回车命令行输入命令
logstash -f logstash.conf5、打开浏览器地址栏输入http://localhost:9600表示启动成功。
6、读取文件 file【file_log.conf】
input {
    file {
        type => "type_a"
        path => ["/usr/local/logstash-2.3.4/config/type/a.txt"]
    }

}
output{
    elasticsearch {
        hosts => ["192.168.136.13:9200"]
        index => "tcp_log"
        #user => "elastic"
        #password => "123456"
    }
}
7、读取网络 tcp【tcp_log.conf】
input{
    tcp{
        port => 8001
        type => "tcp"
        mode => "server"
    }
}
output{
    elasticsearch {
        hosts => ["192.168.136.13:9200"]
        index => "tcp_log"
        #user => "elastic"
        #password => "123456"
    }
}
8、NLog.config文件
在nlog中配置文件targets节点下添加一个target就可以定义一个日志输出目标当需要把日志输送到logstash时需要添加一个target节点其type为Network填上addresslayout等等代码如下
<targets>
  <target xsi:type="Network"
        name="logInfo"
        keepConnection="false"
        layout="${customer-ip} ${customer-method} ${customer-path} ${customer-bytes} ${customer-duration}"
        address ="tcp://127.0.0.1:8001"
  >
  </target>
</targets>
<rules>
  <logger name="*" minlevel="Info" writeTo="logInfo" />
  <logger name="Microsoft.*" maxLevel="Info" final="true" />
</rules>
9、读取 redis 数据【redis_log.conf】
input{
    redis {
        host => "127.0.0.1"
        port => 6379
        db => 0
        data_type => "list"
        key => 'redis_log'
        batch_count => 1
        type => 'redis_log'
    }
}
output{
    elasticsearch {
        hosts => ["192.168.136.13:9200"]
        index => "redis_log"
        #user => "elastic"
        #password => "123456"
    }
}
10、kafka
input{
    kafka {
        topics => "kafkalog"
        bootstrap_servers => "localhost:9092"
        codes => "json"
    }
}
output{
    elasticsearch {
        hosts => ["192.168.136.13:9200"]
        index => "kafka_log"
        #user => "elastic"
        #password => "123456"
    }
}
11、读取 Syslog 数据
input{
    syslog {
        port => 5000
        type => "syslog"
    }
}
output{
    elasticsearch {
        hosts => ["192.168.136.13:9200"]
        index => "kafka_log"
        #user => "elastic"
        #password => "123456"
    }
}
*
*
*