

vue中使用echarts 动态渲染数据
| 阿里云国内75折 回扣 微信号:monov8 |
| 阿里云国际,腾讯云国际,低至75折。AWS 93折 免费开户实名账号 代冲值 优惠多多 微信号:monov8 飞机:@monov6 |
一、业务场景
最近在vue中使用echarts时 引入的时候怎么也引不上后面发现需要绑定在原型上就可以完美解决(也可以直接在需要引入的页面用ES5中的require引入require‘echarts’)
为了避免大家走弯路下面整合了一下echarts 在vue框架中的使用步骤
二、具体实现步骤
1、先在终端安装echarts
npm install echarts --save
2、在main.js中引入这里分5.0以上和以下两个版本来安装
5.0以上版本
import * as echarts from 'echarts'
5.0以下版本
import echarts from 'echarts'
注册在原型上 `
vue.prototype.$echarts = echarts
3、在html部分留一个div容器来承载画布
<div id="main" style="width: 500px;height:400px;"></div>
4、把要实现的代码放入函数中
   init() {
   //调接口
        quShiPic({})
          .then(res => {
            console.log(res)
            const { data, count, code, msg } = res
            if (msg == 'success') {
              this.quLineLists = data
              console.log(this.quLineLists)
              console.log(this.quLineLists[0].data)
              console.log(this.quLineLists[1].data)
              console.log(this.quLineLists[2].data)
              // 基于准备好的dom初始化echarts实例
              var myChart = this.$echarts.init(
                document.getElementById('main')
              )
              // 配置option选项
              var option = {
                title: {
                  text: '热力变化曲线'
                },
                tooltip: {
                  trigger: 'axis'
                },
                legend: {
                  data: ['全部', '人', '物']
                },
                grid: {
                  left: '3%',
                  right: '2%',
                  bottom: '3%',
                  containLabel: true
                },
                toolbox: {
                  feature: {
                    saveAsImage: {}
                  }
                },
                xAxis: {
                  type: 'category',
                  boundaryGap: false,
                  data: ['0', '1', '2', '3', '4', '5', '6', '7', '8', '9', '10', '11', '12', '13', '14', '15', '16', '17', '18', '19', '20', '21', '22', '23']
                },
                yAxis: {
                  type: 'value'
                },
                series:
                  [
                    {
                      name: '全部',
                      type: 'line',
                      stack: 'Total',
                      smooth: true,
                      // data: [120, 132,0, 101, 134, 90,0, 230, 210]
                      data: this.quLineLists[0].data
                    },
                    {
                      name: '人',
                      type: 'line',
                      smooth: true,
                      stack: 'Total',
                      // data: [220, 182, 191, 234, 290, 330, 310]
                      data: this.quLineLists[1].data
                    },
                    {
                      name: '物',
                      type: 'line',
                      stack: 'Total',
                      smooth: true,
                      // data: [150, 232, 201, 154, 190, 330, 410]
                      data: this.quLineLists[2].data
                    }
                  ]
              }
              // 把配置option选项用js放进dom节点
              myChart.setOption(option)
            }
          }).catch((err) => {
          console.log(err)
        })
      },
5、页面加载的时候调用功能函数mounted生命周期里
    mounted() {
      this.init()
    },
三、完整代码
<template>
  <div>
    <div id="main" style="width: 600px;height:400px;"></div>
  </div>
</template>
<script>
  export default {
    name: 'WhiteName',
    data() {
      return {}
    },
    mounted() {
      this.init()
    },
    methods: {
   getLine() {
        quShiPic({})
          .then(res => {
            console.log(res)
            const { data, count, code, msg } = res
            if (msg == 'success') {
              this.quLineLists = data
              console.log(this.quLineLists)
              console.log(this.quLineLists[0].data)
              console.log(this.quLineLists[1].data)
              console.log(this.quLineLists[2].data)
              // 基于准备好的dom初始化echarts实例
              var myChart = this.$echarts.init(
                document.getElementById('main')
              )
              // 配置option选项
              var option = {
                title: {
                  text: '热力变化曲线'
                },
                tooltip: {
                  trigger: 'axis'
                },
                legend: {
                  data: ['全部', '人', '物']
                },
                grid: {
                  left: '3%',
                  right: '2%',
                  bottom: '3%',
                  containLabel: true
                },
                toolbox: {
                  feature: {
                    saveAsImage: {}
                  }
                },
                xAxis: {
                  type: 'category',
                  boundaryGap: false,
                  data: ['0', '1', '2', '3', '4', '5', '6', '7', '8', '9', '10', '11', '12', '13', '14', '15', '16', '17', '18', '19', '20', '21', '22', '23']
                },
                yAxis: {
                  type: 'value'
                },
                series:
                  [
                    {
                      name: '全部',
                      type: 'line',
                      stack: 'Total',
                      smooth: true,
                      // data: [120, 132,0, 101, 134, 90,0, 230, 210]
                      data: this.quLineLists[0].data
                    },
                    {
                      name: '人',
                      type: 'line',
                      smooth: true,
                      stack: 'Total',
                      // data: [220, 182, 191, 234, 290, 330, 310]
                      data: this.quLineLists[1].data
                    },
                    {
                      name: '物',
                      type: 'line',
                      stack: 'Total',
                      smooth: true,
                      // data: [150, 232, 201, 154, 190, 330, 410]
                      data: this.quLineLists[2].data
                    }
                  ]
              }
              // 把配置option选项用js放进dom节点
              myChart.setOption(option)
            }
          }).catch((err) => {
          console.log(err)
        })
      },
      }
    }
  }
</script>

<style scoped>

</style>
四、效果展示
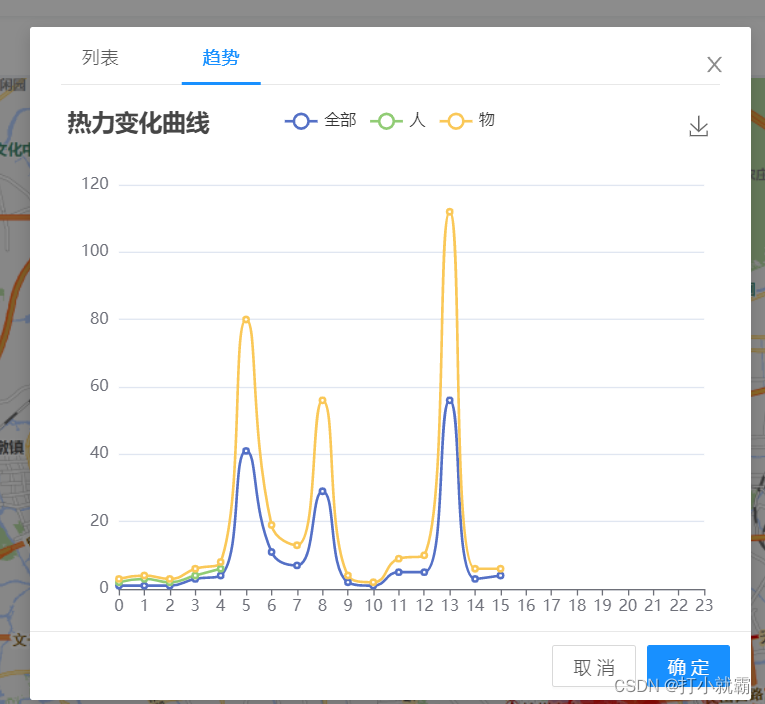
你已经成功了撒花。
今天的分享到此结束欢迎小伙伴们一起交流