

SpringBoot指标监控
| 阿里云国内75折 回扣 微信号:monov8 |
| 阿里云国际,腾讯云国际,低至75折。AWS 93折 免费开户实名账号 代冲值 优惠多多 微信号:monov8 飞机:@monov6 |
目录
一、SpringBoot Actuator
1、简介
未来每一个微服务在云上部署以后我们都需要对其进行监控、追踪、审计、控制等。SpringBoot就抽取了Actuator场景使得我们每个微服务快速引用即可获得生产级别的应用监控、审计等功能。
        <dependency>
            <groupId>org.springframework.boot</groupId>
            <artifactId>spring-boot-starter-actuator</artifactId>
        </dependency>
2、1.x与2.x的不同

3、如何使用
●引入场景
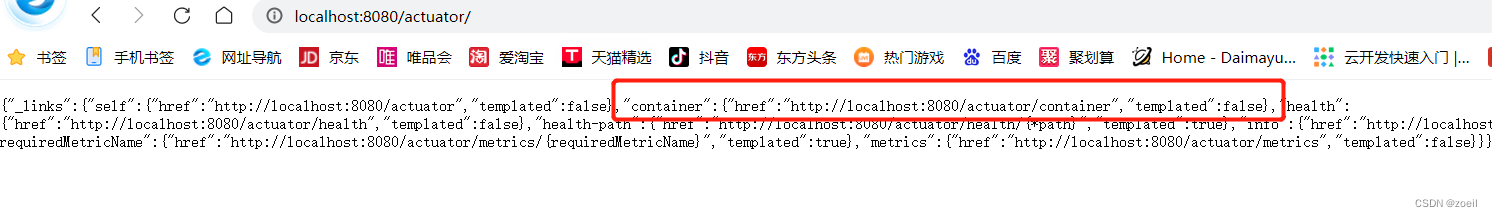
●访问 http://localhost:8080/actuator/**
●暴露所有监控信息为HTTP
management:
  endpoints:
    enabled-by-default: true #true为暴露所有端点信息
    web:
      exposure:
include: '*' #以web方式暴露- 测试
http://localhost:8080/actuator/beans
http://localhost:8080/actuator/configprops
http://localhost:8080/actuator/metrics
http://localhost:8080/actuator/metrics/jvm.gc.pause
格式:http://localhost:8080/actuator/endpointName/detailPath
二、Actuator Endpoint
1、最常使用的端点
| ID | 描述 |
|
| 暴露当前应用程序的审核事件信息。需要一个 |
|
| 显示应用程序中所有Spring Bean的完整列表。 |
|
| 暴露可用的缓存。 |
|
| 显示自动配置的所有条件信息包括匹配或不匹配的原因。 |
|
| 显示所有 |
|
| 暴露Spring的属性 |
|
| 显示已应用的所有Flyway数据库迁移。 |
|
| 显示应用程序运行状况信息。 |
|
| 显示HTTP跟踪信息(默认情况下最近100个HTTP请求-响应)。需要一个 |
|
| 显示应用程序信息。 |
|
| 显示Spring |
|
| 显示和修改应用程序中日志的配置。 |
|
| 显示已应用的所有Liquibase数据库迁移。需要一个或多个 |
|
| 显示当前应用程序的“指标”信息。 |
|
| 显示所有 |
|
| 显示应用程序中的计划任务。 |
|
| 允许从Spring Session支持的会话存储中检索和删除用户会话。需要使用Spring Session的基于Servlet的Web应用程序。 |
|
| 使应用程序正常关闭。默认禁用。 |
|
| 显示由 |
|
| 执行线程转储。 |
如果您的应用程序是Web应用程序(Spring MVCSpring WebFlux或Jersey)则可以使用以下附加端点:
| ID | 描述 |
|
| 返回 |
|
| 通过HTTP暴露JMX bean(需要引入Jolokia不适用于WebFlux)。需要引入依赖 |
|
| 返回日志文件的内容(如果已设置 |
|
| 以Prometheus服务器可以抓取的格式公开指标。需要依赖 |
最常用的Endpoint
- Health:监控状况
- Metrics:运行时指标
- Loggers:日志记录
2、Health Endpoint
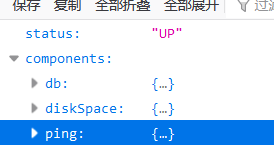
健康检查端点我们一般用于在云平台平台会定时的检查应用的健康状况我们就需要Health Endpoint可以为平台返回当前应用的一系列组件健康状况的集合。
重要的几点:
- health endpoint返回的结果应该是一系列健康检查后的一个汇总报告
- 很多的健康检查默认已经自动配置好了比如:数据库、redis等
- 可以很容易的添加自定义的健康检查机制
3、Metrics Endpoint
提供详细的、层级的、空间指标信息这些信息可以被pull(主动推送)或者push(被动获取)方式得到;
- 通过Metrics对接多种监控系统
- 简化核心Metrics开发
- 添加自定义Metrics或者扩展已有Metrics

4、管理Endpoints
1、开启与禁用Endpoints
- 默认所有的Endpoint除过shutdown都是开启的。
- 需要开启或者禁用某个Endpoint。配置模式为 management.endpoint.<endpointName>.enabled = true
management:
  endpoint:
    beans:
enabled: true- 或者禁用所有的Endpoint然后手动开启指定的Endpoint
management:
  endpoints:
    enabled-by-default: false
  endpoint:
    beans:
      enabled: true
    health:
      enabled: true
2、暴露Endpoints
支持的暴露方式
- HTTP:默认只暴露health和info Endpoint
- JMX:默认暴露所有Endpoint
- 除过health和info剩下的Endpoint都应该进行保护访问。如果引入SpringSecurity则会默认配置安全访问规则
| ID | JMX | Web |
|
| Yes | No |
|
| Yes | No |
|
| Yes | No |
|
| Yes | No |
|
| Yes | No |
|
| Yes | No |
|
| Yes | No |
|
| Yes | Yes |
|
| N/A | No |
|
| Yes | No |
|
| Yes | Yes |
|
| Yes | No |
|
| N/A | No |
|
| N/A | No |
|
| Yes | No |
|
| Yes | No |
|
| Yes | No |
|
| Yes | No |
|
| N/A | No |
|
| Yes | No |
|
| Yes | No |
|
| Yes | No |
|
| Yes | No |
|
| Yes | No |
三、定制 Endpoint
1、定制 Health 信息
方法1
import org.springframework.boot.actuate.health.Health;
import org.springframework.boot.actuate.health.HealthIndicator;
import org.springframework.stereotype.Component;

@Component
public class MyHealthIndicator implements HealthIndicator {

    @Override
    public Health health() {
        int errorCode = check(); // perform some specific health check
        if (errorCode != 0) {
            return Health.down().withDetail("Error Code", errorCode).build();
        }
        return Health.up().build();
    }

}

构建Health
Health build = Health.down()
                .withDetail("msg", "error service")
                .withDetail("code", "500")
                .withException(new RuntimeException())
                .build();
management:
health:
enabled: true
show-details: always #总是显示详细信息。可显示每个模块的状态信息方法2:继承抽象方法AbstractHealthIndicator
@Component
public class MyComHealthIndicator extends AbstractHealthIndicator {

    /**
     * 真实的检查方法
     * @param builder
     * @throws Exception
     */
    @Override
    protected void doHealthCheck(Health.Builder builder) throws Exception {
        //mongodb。  获取连接进行测试
        Map<String,Object> map = new HashMap<>();
        // 检查完成
        if(1 == 2){
//            builder.up(); //健康
            builder.status(Status.UP);
            map.put("count",1);
            map.put("ms",100);
        }else {
//            builder.down();
            builder.status(Status.OUT_OF_SERVICE);
            map.put("err","连接超时");
            map.put("ms",3000);
        }


        builder.withDetail("code",100)
                .withDetails(map);

    }
}
2、定制info信息
常用两种方式
1、编写配置文件
info:
  appName: boot-admin
  version: 2.0.1
  mavenProjectName: @project.artifactId@  #使用@@可以获取maven的pom文件值
  mavenProjectVersion: @project.version@
2、编写InfoContributor
@Component
public class ExampleInfoContributor implements InfoContributor {
    @Override
    public void contribute(Info.Builder builder) {
        builder.withDetail("msg", "你好")
                .withDetail("hello", "world")
                .withDetails(Collections.singletonMap("world", "66660"));
    }
}
http://localhost:8080/actuator/info 会输出以上方式返回的所有info信息
3、定制Metrics信息
1、SpringBoot支持自动适配的Metrics
- JVM metrics, report utilization of:
-
- Various memory and buffer pools
- Statistics related to garbage collection
- Threads utilization
- Number of classes loaded/unloaded
- CPU metrics
- File descriptor metrics
- Kafka consumer and producer metrics
- Log4j2 metrics: record the number of events logged to Log4j2 at each level
- Logback metrics: record the number of events logged to Logback at each level
- Uptime metrics: report a gauge for uptime and a fixed gauge representing the application’s absolute start time
- Tomcat metrics (
server.tomcat.mbeanregistry.enabledmust be set totruefor all Tomcat metrics to be registered) - Spring Integration metrics
2、增加定制Metrics
class MyService{
    Counter counter;
    public MyService(MeterRegistry meterRegistry){
         counter = meterRegistry.counter("myservice.method.running.counter");
    }

    public void hello() {
        counter.increment();
    }
}


//也可以使用下面的方式
@Bean
MeterBinder queueSize(Queue queue) {
    return (registry) -> Gauge.builder("queueSize", queue::size).register(registry);
}
例子:
@Service
public class UserServiceImpl extends ServiceImpl<UserMapper, User> implements UserService {

    @Autowired
    tUserMapper userMapper;

    Counter counter;
    public UserServiceImpl(MeterRegistry meterRegistry) {
        //记录saveUser方法被访问几次
        counter = meterRegistry.counter("userservice.saveuser");
    }

    public void saveUser(User user) {
        counter.increment();
        userMapper.saveUser(user);
    }

}
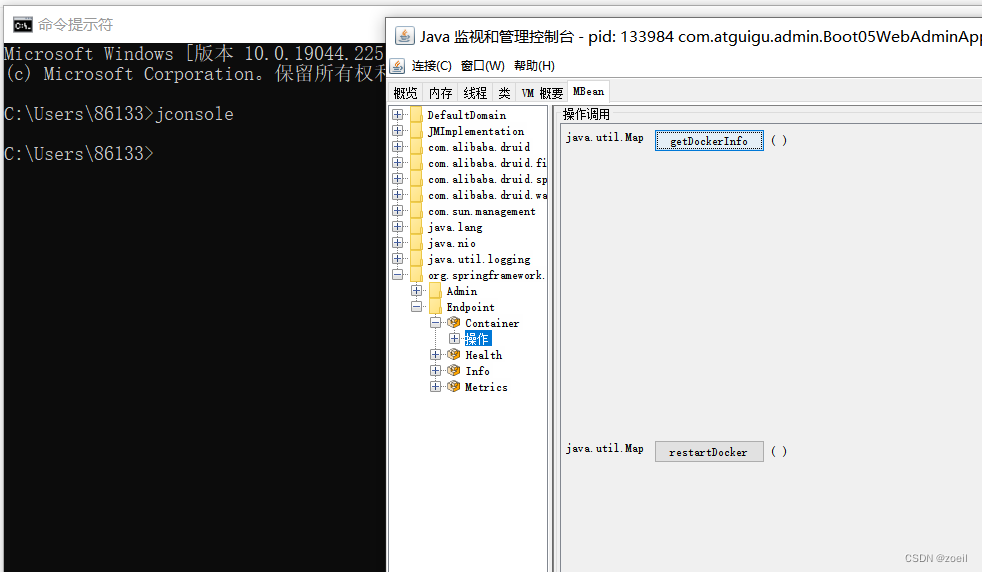
4、定制Endpoint
@Component
@Endpoint(id = "container")
public class DockerEndpoint {


    //get方法是页面访问endpoint结点放回的信息
    @ReadOperation
    public Map getDockerInfo(){
        return Collections.singletonMap("info","docker started...");
    }

    //read可以通过cmd命令窗口打开jconsole连接项目执行这个方法
    @WriteOperation
    private void restartDocker(){
        System.out.println("docker restarted....");
    }

}
get

read
场景:开发ReadinessEndpoint来管理程序是否就绪或者LivenessEndpoint来管理程序是否存活;
当然这个也可以直接使用 Production-ready Features