

【附代码】十大主流聚类算法
| 阿里云国内75折 回扣 微信号:monov8 |
| 阿里云国际,腾讯云国际,低至75折。AWS 93折 免费开户实名账号 代冲值 优惠多多 微信号:monov8 飞机:@monov6 |
准备工作
安装必要的库
pip install scikit-learn准备数据集
使用 make _ classification ()函数创建一个测试二分类数据集。数据集将有1000个示例每个类有两个输入要素和一个群集。这些群集在两个维度上是可见的因此我们可以用散点图绘制数据并通过指定的群集对图中的点进行颜色绘制。
# 综合分类数据集
from numpy import where
from sklearn.datasets import make_classification
from matplotlib import pyplot
%matplotlib inline

# 定义数据集
X, y = make_classification(n_samples=1000,
                           n_features=2,
                           n_informative=2,
                           n_redundant=0,
                           n_clusters_per_class=1,
                           random_state=4)
# 为每个类的样本创建散点图
for class_value in range(2):
    # 获取此类的示例的行索引
    row_ix = where(y == class_value)
    # 创建这些样本的散布
    pyplot.scatter(X[row_ix, 0], X[row_ix, 1])
    # 绘制散点图
pyplot.show()- 亲和力传播聚类AffinityPropagation
# 亲和力传播聚类
from numpy import unique
from numpy import where
from sklearn.datasets import make_classification
from sklearn.cluster import AffinityPropagation
from matplotlib import pyplot
# 定义数据集
X, _ = make_classification(n_samples=1000,
                           n_features=2,
                           n_informative=2,
                           n_redundant=0,
                           n_clusters_per_class=1,
                           random_state=4)
# 定义模型
model = AffinityPropagation(damping=0.9)
# 匹配模型
model.fit(X)
# 为每个示例分配一个集群
yhat = model.predict(X)
# 检索唯一群集
clusters = unique(yhat)
# 为每个群集的样本创建散点图
for cluster in clusters:
    # 获取此群集的示例的行索引
    row_ix = where(yhat == cluster)
    # 创建这些样本的散布
    pyplot.scatter(X[row_ix, 0], X[row_ix, 1])
# 绘制散点图
pyplot.show()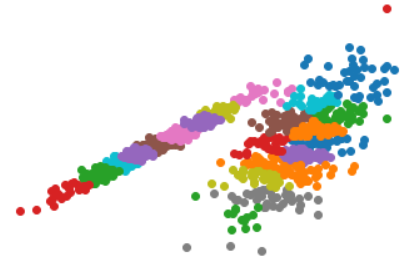
- 聚合聚类
# 聚合聚类
from numpy import unique
from numpy import where
from sklearn.datasets import make_classification
from sklearn.cluster import AgglomerativeClustering
from matplotlib import pyplot
# 定义数据集
X, _ = make_classification(n_samples=1000,
                           n_features=2,
                           n_informative=2,
                           n_redundant=0,
                           n_clusters_per_class=1,
                           random_state=4)
# 定义模型
model = AgglomerativeClustering(n_clusters=2)
# 模型拟合与聚类预测
yhat = model.fit_predict(X)
# 检索唯一群集
clusters = unique(yhat)
# 为每个群集的样本创建散点图
for cluster in clusters:
    # 获取此群集的示例的行索引
    row_ix = where(yhat == cluster)
    # 创建这些样本的散布
    pyplot.scatter(X[row_ix, 0], X[row_ix, 1])
# 绘制散点图
pyplot.show()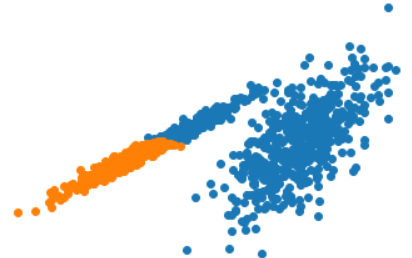
- BIRCH平衡迭代减少--层次算法
# birch聚类
from numpy import unique
from numpy import where
from sklearn.datasets import make_classification
from sklearn.cluster import Birch
from matplotlib import pyplot
# 定义数据集
X, _ = make_classification(n_samples=1000,
                           n_features=2,
                           n_informative=2,
                           n_redundant=0,
                           n_clusters_per_class=1,
                           random_state=4)
# 定义模型
model = Birch(threshold=0.01, n_clusters=2)
# 适配模型
model.fit(X)
# 为每个示例分配一个集群
yhat = model.predict(X)
# 检索唯一群集
clusters = unique(yhat)
# 为每个群集的样本创建散点图
for cluster in clusters:
    # 获取此群集的示例的行索引
    row_ix = where(yhat == cluster)
    # 创建这些样本的散布
    pyplot.scatter(X[row_ix, 0], X[row_ix, 1])
# 绘制散点图
pyplot.show()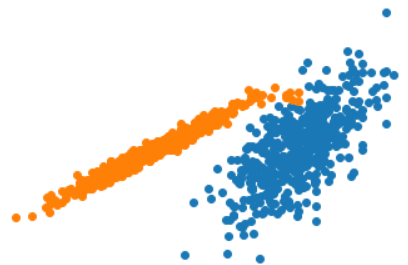
- DBSCAN
DBSCAN 是基于密度的空间聚类
# dbscan 聚类
from numpy import unique
from numpy import where
from sklearn.datasets import make_classification
from sklearn.cluster import DBSCAN
from matplotlib import pyplot
# 定义数据集
X, _ = make_classification(n_samples=1000,
                           n_features=2,
                           n_informative=2,
                           n_redundant=0,
                           n_clusters_per_class=1,
                           random_state=4)
# 定义模型
model = DBSCAN(eps=0.30, min_samples=9)
# 模型拟合与聚类预测
yhat = model.fit_predict(X)
# 检索唯一群集
clusters = unique(yhat)
# 为每个群集的样本创建散点图
for cluster in clusters:
    # 获取此群集的示例的行索引
    row_ix = where(yhat == cluster)
    # 创建这些样本的散布
    pyplot.scatter(X[row_ix, 0], X[row_ix, 1])
# 绘制散点图
pyplot.show()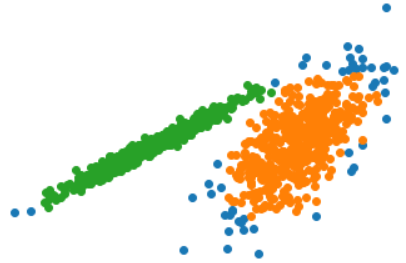
- k-means聚类
# k-means 聚类
from numpy import unique
from numpy import where
from sklearn.datasets import make_classification
from sklearn.cluster import KMeans
from matplotlib import pyplot
# 定义数据集
X, _ = make_classification(n_samples=1000,
                           n_features=2,
                           n_informative=2,
                           n_redundant=0,
                           n_clusters_per_class=1,
                           random_state=4)
# 定义模型
model = KMeans(n_clusters=2)
# 模型拟合
model.fit(X)
# 为每个示例分配一个集群
yhat = model.predict(X)
# 检索唯一群集
clusters = unique(yhat)
# 为每个群集的样本创建散点图
for cluster in clusters:
    # 获取此群集的示例的行索引
    row_ix = where(yhat == cluster)
    # 创建这些样本的散布
    pyplot.scatter(X[row_ix, 0], X[row_ix, 1])
# 绘制散点图
pyplot.show()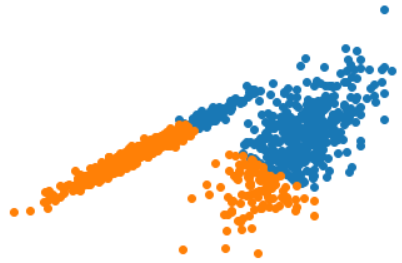
- Mini-Batch K-均值
使大数据集的更新速度更快并且可能对统计噪声更健壮。
# mini-batch k均值聚类
from numpy import unique
from numpy import where
from sklearn.datasets import make_classification
from sklearn.cluster import MiniBatchKMeans
from matplotlib import pyplot
# 定义数据集
X, _ = make_classification(n_samples=1000,
                           n_features=2,
                           n_informative=2,
                           n_redundant=0,
                           n_clusters_per_class=1,
                           random_state=4)
# 定义模型
model = MiniBatchKMeans(n_clusters=2)
# 模型拟合
model.fit(X)
# 为每个示例分配一个集群
yhat = model.predict(X)
# 检索唯一群集
clusters = unique(yhat)
# 为每个群集的样本创建散点图
for cluster in clusters:
    # 获取此群集的示例的行索引
    row_ix = where(yhat == cluster)
    # 创建这些样本的散布
    pyplot.scatter(X[row_ix, 0], X[row_ix, 1])
# 绘制散点图
pyplot.show()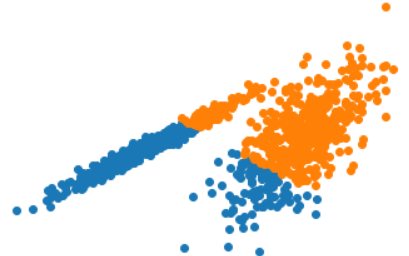
- 均值漂移聚类
均值漂移聚类涉及到根据特征空间中的实例密度来寻找和调整质心。
# 均值漂移聚类
from numpy import unique
from numpy import where
from sklearn.datasets import make_classification
from sklearn.cluster import MeanShift
from matplotlib import pyplot
# 定义数据集
X, _ = make_classification(n_samples=1000,
                           n_features=2,
                           n_informative=2,
                           n_redundant=0,
                           n_clusters_per_class=1,
                           random_state=4)
# 定义模型
model = MeanShift()
# 模型拟合与聚类预测
yhat = model.fit_predict(X)
# 检索唯一群集
clusters = unique(yhat)
# 为每个群集的样本创建散点图
for cluster in clusters:
    # 获取此群集的示例的行索引
    row_ix = where(yhat == cluster)
    # 创建这些样本的散布
    pyplot.scatter(X[row_ix, 0], X[row_ix, 1])
# 绘制散点图
pyplot.show()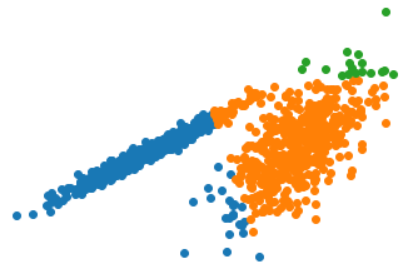
- OPTICS聚类
# optics聚类
from numpy import unique
from numpy import where
from sklearn.datasets import make_classification
from sklearn.cluster import OPTICS
from matplotlib import pyplot
# 定义数据集
X, _ = make_classification(n_samples=1000,
                           n_features=2,
                           n_informative=2,
                           n_redundant=0,
                           n_clusters_per_class=1,
                           random_state=4)
# 定义模型
model = OPTICS(eps=0.8, min_samples=10)
# 模型拟合与聚类预测
yhat = model.fit_predict(X)
# 检索唯一群集
clusters = unique(yhat)
# 为每个群集的样本创建散点图
for cluster in clusters:
    # 获取此群集的示例的行索引
    row_ix = where(yhat == cluster)
    # 创建这些样本的散布
    pyplot.scatter(X[row_ix, 0], X[row_ix, 1])
# 绘制散点图
pyplot.show()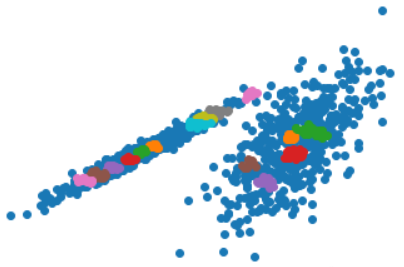
- 光谱聚类
光谱聚类是一类通用的聚类方法取自线性线性代数。
# spectral clustering
from numpy import unique
from numpy import where
from sklearn.datasets import make_classification
from sklearn.cluster import SpectralClustering
from matplotlib import pyplot
# 定义数据集
X, _ = make_classification(n_samples=1000,
                           n_features=2,
                           n_informative=2,
                           n_redundant=0,
                           n_clusters_per_class=1,
                           random_state=4)
# 定义模型
model = SpectralClustering(n_clusters=2)
# 模型拟合与聚类预测
yhat = model.fit_predict(X)
# 检索唯一群集
clusters = unique(yhat)
# 为每个群集的样本创建散点图
for cluster in clusters:
    # 获取此群集的示例的行索引
    row_ix = where(yhat == cluster)
    # 创建这些样本的散布
    pyplot.scatter(X[row_ix, 0], X[row_ix, 1])
# 绘制散点图
pyplot.show()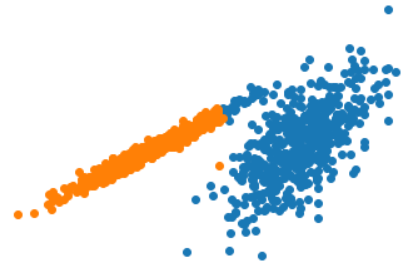
- 高斯混合模型
高斯混合模型总结了一个多变量概率密度函数顾名思义就是混合了高斯概率分布。
# 高斯混合模型
from numpy import unique
from numpy import where
from sklearn.datasets import make_classification
from sklearn.mixture import GaussianMixture
from matplotlib import pyplot
# 定义数据集
X, _ = make_classification(n_samples=1000,
                           n_features=2,
                           n_informative=2,
                           n_redundant=0,
                           n_clusters_per_class=1,
                           random_state=4)
# 定义模型
model = GaussianMixture(n_components=2)
# 模型拟合
model.fit(X)
# 为每个示例分配一个集群
yhat = model.predict(X)
# 检索唯一群集
clusters = unique(yhat)
# 为每个群集的样本创建散点图
for cluster in clusters:
    # 获取此群集的示例的行索引
    row_ix = where(yhat == cluster)
    # 创建这些样本的散布
    pyplot.scatter(X[row_ix, 0], X[row_ix, 1])
# 绘制散点图
pyplot.show()
如果内容对您有帮助请记得点赞+收藏您的支持是我坚持的动力~