

用Python画科赫雪花_python飘雪
| 阿里云国内75折 回扣 微信号:monov8 |
| 阿里云国际,腾讯云国际,低至75折。AWS 93折 免费开户实名账号 代冲值 优惠多多 微信号:monov8 飞机:@monov6 |
文章目录
科赫曲线
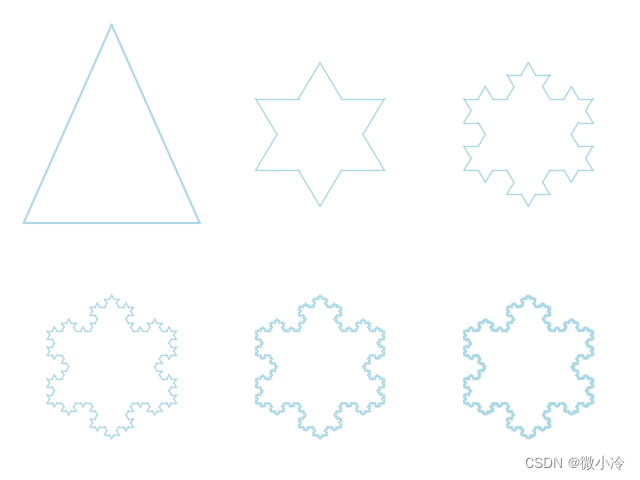
科赫曲线因为十分像雪花所以被成为雪花曲线生成方式十分简单总共分两步
- 画一个正三角形
- 将正三角形的每个边三等分然后以中间的那份为边再画出个三角形。
- 重复第二步。
那么难点无非是三等分后如何新画一个三角形更进一步新三角形的那个新顶点在哪里?
设已知两点 ( x 1 , y 1 ) , ( x 2 , y 2 ) (x_1,y_1),(x_2,y_2) (x1,y1),(x2,y2)设正三角形的第三点为 ( x , y ) (x,y) (x,y)则将坐标系平移到 ( x 1 , y 1 ) (x_1,y_1) (x1,y1)后对 ( x 2 , y 2 ) (x_2,y_2) (x2,y2)旋转60°即可。
[ x y ] = [ x 1 y 1 ] + [ cos π 3 − sin π 3 sin π 3 cos π 3 ] ⋅ [ x 2 − x 1 y 2 − y 1 ] = [ x 1 + 1 2 ( x 2 − x 1 ) − 3 2 ( y 2 − y 1 ) y 1 + 3 2 ( x 2 − x 1 ) + 1 2 ( y 2 − y 1 ) ] = [ 1 2 ( x 2 + x 1 ) − 3 2 ( y 2 − y 1 ) 1 2 ( y 2 + y 1 ) + 3 2 ( x 2 − x 1 ) ] \begin{aligned} \begin{bmatrix}x\\ y\end{bmatrix}&= \begin{bmatrix}x_1\\ y_1\end{bmatrix}+ \begin{bmatrix}\cos\frac{\pi}{3} &-\sin\frac{\pi}{3}\\ \sin\frac{\pi}{3}&\cos\frac{\pi}{3}\end{bmatrix}\cdot \begin{bmatrix}x_2-x_1\\ y_2-y_1\end{bmatrix}\\ &=\begin{bmatrix} x_1 + \frac{1}{2}(x_2-x_1)-\frac{\sqrt 3}{2}(y_2-y_1)\\ y_1 + \frac{\sqrt{3}}{2}(x_2-x_1)+\frac{1}{2}(y_2-y_1)\end{bmatrix}\\ &=\begin{bmatrix} \frac{1}{2}(x_2+x_1)-\frac{\sqrt 3}{2}(y_2-y_1)\\ \frac{1}{2}(y_2+y_1)+\frac{\sqrt{3}}{2}(x_2-x_1)\end{bmatrix} \end{aligned} [xy]=[x1y1]+[cos3πsin3π−sin3πcos3π]⋅[x2−x1y2−y1]=[x1+21(x2−x1)−23(y2−y1)y1+23(x2−x1)+21(y2−y1)]=[21(x2+x1)−23(y2−y1)21(y2+y1)+23(x2−x1)]
写成Python就是
import numpy as np
import matplotlib.pyplot as plt
from numpy.random import rand,randint

# n>=1生成科赫雪花的方法
def Koch(L,n=1):
    if n<1 : return L
    newL = []    #(x,y)的列表
    k = np.sqrt(3)/2
    for i in range(len(L)-1):
       d = (L[i+1]-L[i])/3
       mid = (L[i]+L[i+1])/2
       xy = [mid[0]-k*d[1], mid[1]+k*d[0]]
       newL += [L[i], L[i]+d, xy, L[i]+d*2]
    newL.append(L[-1])
    return np.array(Koch(newL,n-1))
接下来设置初始三角形并做一个绘图函数
L0 = np.array([[0,0],
    [0.5,np.sqrt(3)/2], [1,0], [0,0] ])

fig = plt.figure()
for i in range(6):
    L = Koch(L0, i)
    ax = fig.add_subplot(2,3,i+1)
    ax.plot(*L.T, c='lightblue', lw=1)
    plt.axis('off')     # 隐藏坐标轴

plt.show()
从而得到
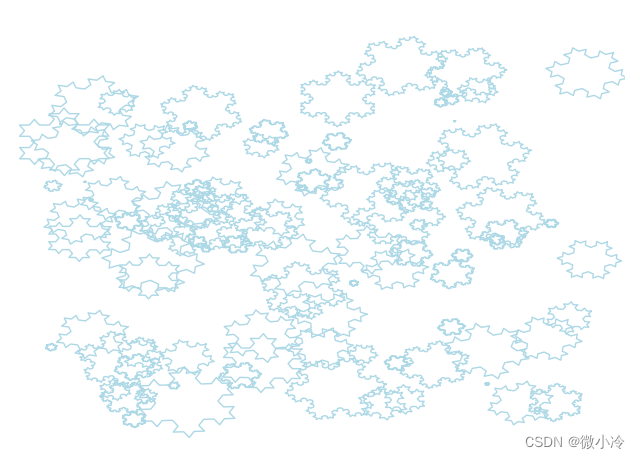
飘雪
既然有许多个雪花那么可能就会有那种飘雪的感觉这里只需用多个随机数生成多组科赫曲线
#n为雪花数量low,high为最低和最高koch雪花阶数
def RandKoch(n,low,high):
    randKochs = []
    rMax = np.sqrt(1/n)
    for _ in range(n):
        cx,cy,t0 = rand(3)
        r = rand()*rMax
        L0 = [np.array([np.cos(t),np.sin(t)])*r+[cx,cy]
            for t in (t0-np.arange(4)*np.pi*2/3)]
        randKochs.append(Koch(L0,randint(low,high)))
    return randKochs

Ls = RandKoch(100, 2,4)
for L in Ls:
    plt.plot(*L.T, c='lightblue', lw=1)

plt.axis('off')
plt.show()

plt.figure(2)
for L in Ls:
    plt.plot(*L.T, c='blue', lw=1)
    plt.fill(*L.T, c='lightblue', lw=1)

plt.show()
其中plt.fill可以填充绘制内容其结果为
 | 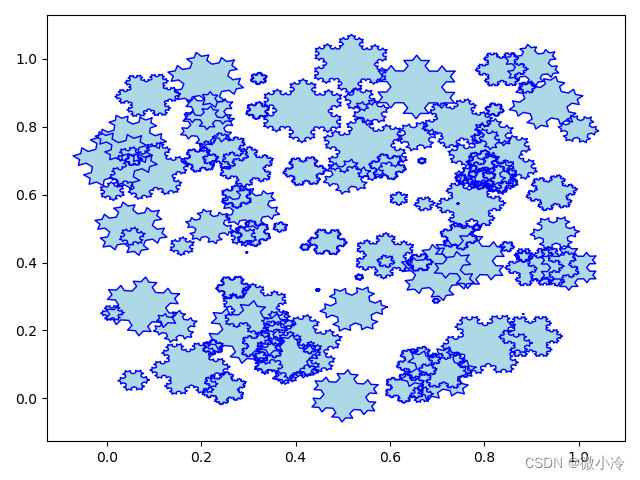 |
三维飘雪
如果想要那种飘雪的感觉至少得有个3D的图这很简单只要加个三维的坐标就可以了。

#导入PolyCollection绘制实心的3D图形
from mpl_toolkits.mplot3d.art3d import PolyCollection
ax = plt.subplot(projection='3d')
p3d = PolyCollection(Ls,facecolors=np.repeat('lightblue',len(Ls)),alpha=0.5)
ax.add_collection3d(p3d,zs=rand(len(Ls)),zdir='y')
# 取消坐标轴的刻度值
for axset in [ax.set_xticks, ax.set_xticks, ax.set_xticks]:
    axset(np.arange(10)/10, ['']*10)
plt.show()