

vue ref和$refs获取dom元素-CSDN博客
| 阿里云国内75折 回扣 微信号:monov8 |
| 阿里云国际,腾讯云国际,低至75折。AWS 93折 免费开户实名账号 代冲值 优惠多多 微信号:monov8 飞机:@monov6 |
vue ref和$refs获取dom元素
**创建 工程
H:\java_work\java_springboot\vue_study
ctrl按住不放 右键 悬着 powershell
H:\java_work\java_springboot\js_study\Vue2_3入门到实战-配套资料\01-随堂代码素材\day04\准备代码\14-ref和$refs获取dom对象
vue --version
vue create v-ref-demo
cd v-ref-demo
npm install echarts --save
npm i echarts-wordcloud --save
npm audit fix --force
npm cache clean --force
npm run serve
补充
是 npm i echarts --save-dev
是npm i echarts这样去安装
是 npm i echarts --save-dev
App.vue
<template>
<div class="app">
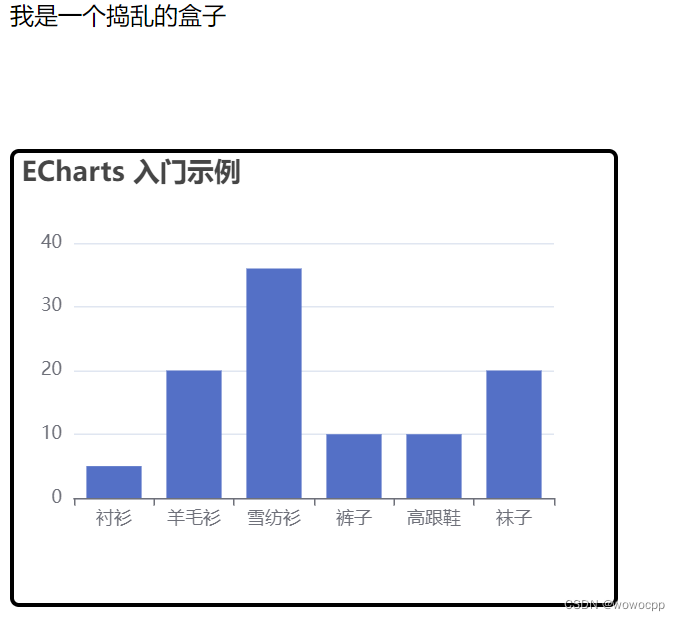
<div class="base-chart-box">我是一个捣乱的盒子</div>
<BaseChart></BaseChart>
</div>
</template>
<script>
import BaseChart from "./components/BaseChart.vue";
export default {
components: {
BaseChart,
},
};
</script>
<style>
.base-chart-box {
width: 200px;
height: 100px;
}
</style>
BaseChart.vue
<template>
<div ref="mychart" class="base-chart-box">子组件</div>
</template>
<script>
import * as echarts from "echarts";
export default {
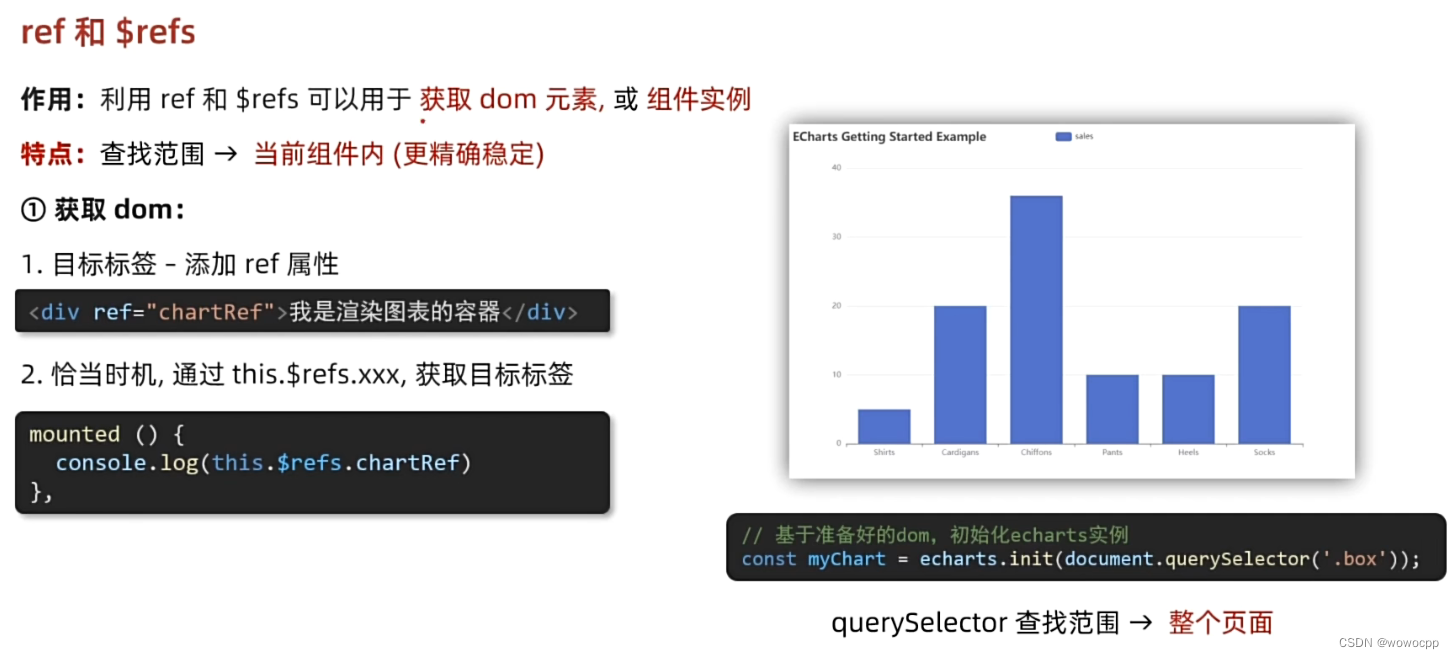
mounted() {
// 基于准备好的dom初始化echarts实例
const myChart = echarts.init(this.$refs.mychart);
//const myChart = echarts.init(document.querySelector(".base-chart-box"));
// 绘制图表
myChart.setOption({
title: {
text: "ECharts 入门示例",
},
tooltip: {},
xAxis: {
data: ["衬衫", "羊毛衫", "雪纺衫", "裤子", "高跟鞋", "袜子"],
},
yAxis: {},
series: [
{
name: "销量",
type: "bar",
data: [5, 20, 36, 10, 10, 20],
},
],
});
},
};
</script>
<style scoped>
.base-chart-box {
width: 400px;
height: 300px;
border: 3px solid #000;
border-radius: 6px;
}
</style>
11
| 阿里云国内75折 回扣 微信号:monov8 |
| 阿里云国际,腾讯云国际,低至75折。AWS 93折 免费开户实名账号 代冲值 优惠多多 微信号:monov8 飞机:@monov6 |