

SLA探活工具EaseProbe简介
| 阿里云国内75折 回扣 微信号:monov8 |
| 阿里云国际,腾讯云国际,低至75折。AWS 93折 免费开户实名账号 代冲值 优惠多多 微信号:monov8 飞机:@monov6 |
因为很喜欢这个工具,我想了几天,决定这样去介绍。
需求:
- 监控 http 接口可用性,及返回的字符串,返回 success 代表成功,返回 failure 则代表失败。
- 监控 tcp 接口可用性
- 监控 ssl 证书过期时间
一个运维拿到这样的需求,会怎么做?
-
安装 Zabbix,用 web 监控 去监控 http 接口,用 net.tcp.service[service,
, ] 监控 tcp 接口,写一个脚本再配置监控项去监控 ssl 证书过期时间,配置钉钉告警。 -
安装 Prometheus,用 blackbox 监控 http、tcp、ssl证书过期时间,安装 alertmanager 、配置钉钉告警。
如果现在有一个工具,只需要填几个配置文件,就能完成上面的所有需求,而且功能还不止于此,会不会让你觉得 awesome!
当然有大佬会说,写个 shell 脚本更简单,那你移动鼠标到右上角有个 X,你点一下。
背景
经常需要知道某个接口或中间件是不是挂了,虽然已经有 zabbix、Prometheus 这样的监控系统,毕竟还是重了些,下面介绍一个轻量级的工具 EaseProbe,在 github 上已经获得 1.5k star,作者是大名鼎鼎的左耳朵耗子,想了解作者的自行谷歌。
主页:https://github.com/megaease/easeprobe
官方介绍:
EaseProbe is a simple, standalone, and lightweight tool that can do health/status checking, written in Go.
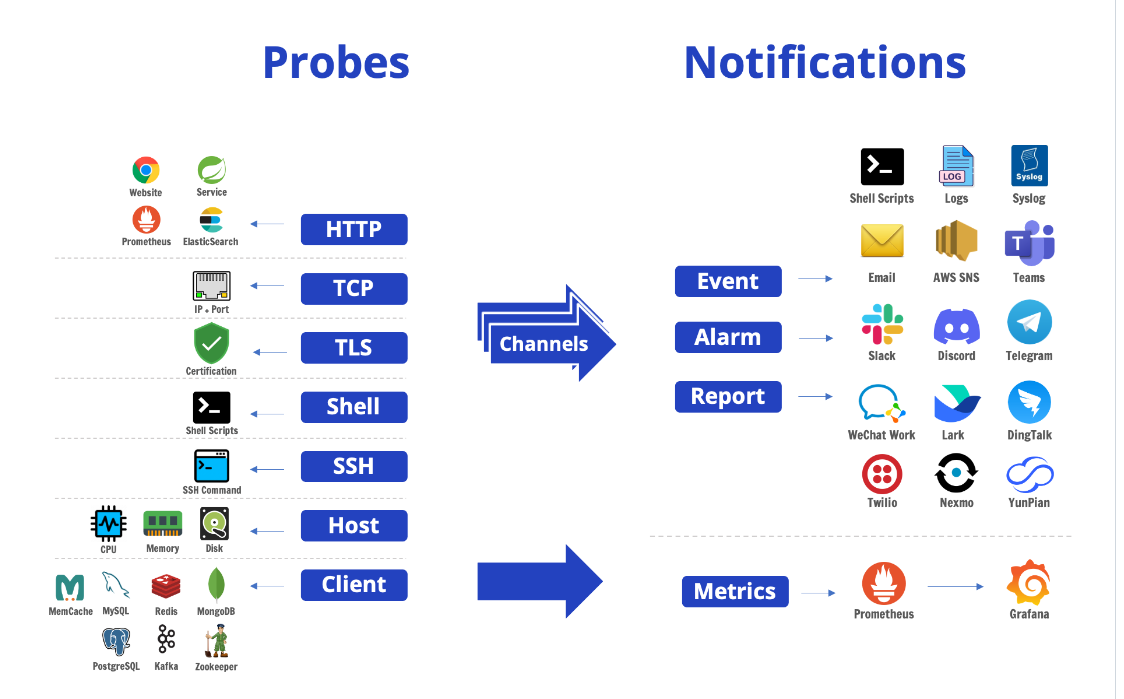
一个开源的健康/状态检查工具,支持以下探测方法:HTTP,TCP,TLS,Shell命令,SSH命令,主机资源使用情况和本机客户端。
实战
上面的需求是如何完成的呢?看如下配置文件
http: # http probes
  - name: prometheus
    url: http://192.168.96.121:9090/prometheus/graph
    username: admin
    password: 123456
    success_code:
      - [200,206] # the code >=200 and <= 206
      - [300,308] # the code >=300 and <= 308
    # Response Checking
    contain: "success" # response body must contain this string, if not the probe is considered failed.
    not_contain: "failure" # response body must NOT contain this string, if it does the probe is considered failed.
  - name: zabbix
    url: http://192.168.96.121/zabbix
    username: admin
    password: 123456
    success_code:
      - [200,206] # the code >=200 and <= 206
      - [300,308] # the code >=300 and <= 308
    # Response Checking
    contain: "success" # response body must contain this string, if not the probe is considered failed.
    not_contain: "failure" # response body must NOT contain this string, if it does the probe is considered failed.

tcp:
  - name: nginx1
    host: 192.168.96.60:80
  - name: nginx2
    host: 192.168.96.58:80


tls:
  - name: xx ssl证书30天后过期
    host: xx.cn:443
    proxy: socks5://proxy.server:1080 # Optional. Only support socks5.
                                    # Also support the `ALL_PROXY` environment.
    insecure_skip_verify: true # dont check cert validity
    expire_skip_verify: false # dont check cert expire date
    alert_expire_before: 720h # alert if cert expire date is before X, the value is a Duration, see https://pkg.go.dev/time#ParseDuration. example: 1h, 1m, 1s. expire_skip_verify must be false to use this feature.
    # root_ca_pem_path: /path/to/root/ca.pem # ignore if root_ca_pem is present
    # root_ca_pem: |
    #   -----BEGIN CERTIFICATE-----

  - name: yyssl证书30天后过期
    host: yy.cn:443
    proxy: socks5://proxy.server:1080 # Optional. Only support socks5.
                                    # Also support the `ALL_PROXY` environment.
    insecure_skip_verify: true # dont check cert validity
    expire_skip_verify: false # dont check cert expire date
    alert_expire_before: 720h # alert if cert expire date is before X, the value is a Duration, see https://pkg.go.dev/time#ParseDuration. example: 1h, 1m, 1s. expire_skip_verify must be false to use this feature.
    # root_ca_pem_path: /path/to/root/ca.pem # ignore if root_ca_pem is present
    # root_ca_pem: |
    #   -----BEGIN CERTIFICATE-----


settings:
  time: "23:59"
  timeformat: "2006-01-02 15:04:05 Z07:00"
  # check the following link to see the time zone list
  # https://en.wikipedia.org/wiki/List_of_tz_database_time_zones
  timezone: "Asia/Shanghai" #  default: UTC
  probe:
    timeout: 30s # the time out for all probes
    interval: 1m # probe every minute for all probes
# SLA Report schedule
sla:
    #  minutely, hourly, daily, weekly (Sunday), monthly (Last Day), none
  schedule: "weekly"
    # UTC time, the format is 'hour:min:sec'
  time: "23:59"


# Notification Configuration
notify:
  dingtalk:
    - name: "dingtalk alert service"
      webhook: "https://oapi.dingtalk.com/robot/send?access_token=123456"
      secret: "" # sign secret if set
  log:
    - name: log file # local log file
      file: /var/log/easeprobe.log
  http:
    port: 8181
    log:
       file: /var/log/easeprobe-http-access.log #<---- access log file location
告警展示
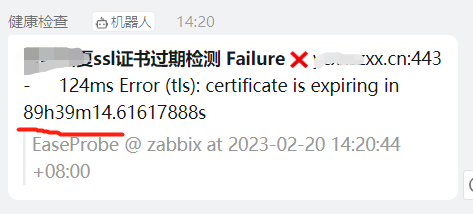
这里有几条告警展示一下
还有 89 个小时 ssl 证书就过期了
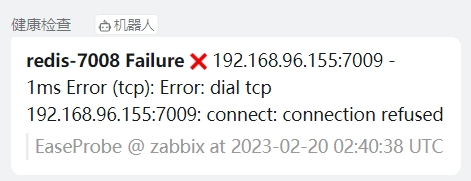
Redis 挂了
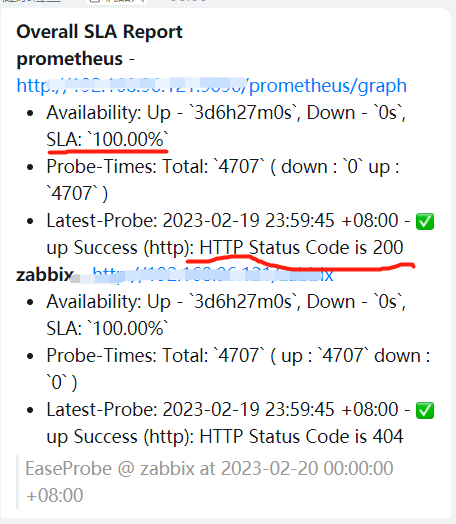
SLA 报表输出,可以设置每分钟,每小时,每星期,每天,每月
其余功能
还支持其他强大的功能,可以去官方查看。
后记
这里并不是说要拿它去和 zabbix、Prometheus 去比较,没有可比性。它只是比较轻,对于一些小的需求,不需要用那么重的软件去完成。就比如统一日志平台,从节省资源的层面来看,rsyslog 比 elk 更加适合。