区块链学习3-长安链并发测试(1)
| 阿里云国内75折 回扣 微信号:monov8 |
| 阿里云国际,腾讯云国际,低至75折。AWS 93折 免费开户实名账号 代冲值 优惠多多 微信号:monov8 飞机:@monov6 |
前置条件
假设有5台host
压力机10.0.51.237
运行四台共识节点的服务器10.0.51.249, 10.0.51.163, 10.0.51.65, 10.0.51.217
关闭防火墙systemctl stop firewalld
禁用防火墙systemctl disable firewalld
其他依赖环境参考官方文档
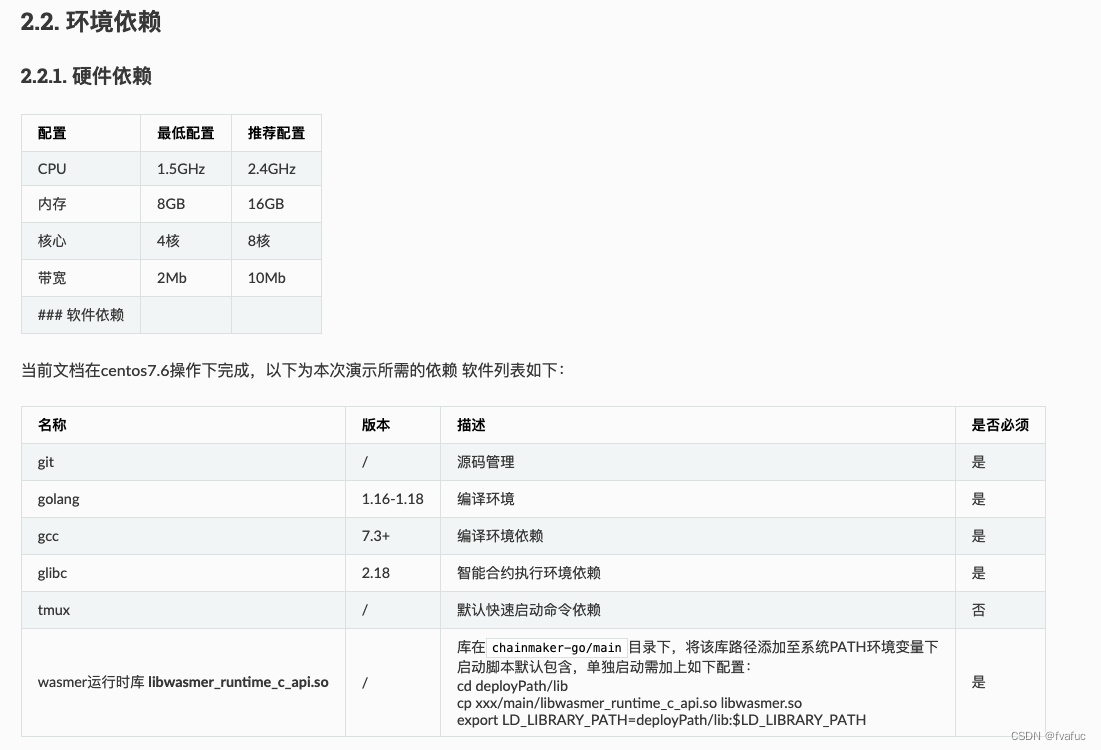
如果测试docker合约还需要依赖
一、部署性能监测环境
监控分为两部分
一个是服务器资源监控这个使用通用完的premethus教程参考下文【添加资源监控配置】
一个是区块链数据监控这个参考长安链官方文档参考长安链并发测试(2)_链部署【配置开启长安链的prometheus监控】
长安链支持prometheus监控可以进行可视化监控参考
https://docs.chainmaker.org.cn/dev/监控运维.html
1. 安装premetheus
由于要监控4台节点所在的服务器因此我们在压力机上安装premetheus
# 下载prometheus安装文件
[root@server ~]# wget https://github.com/prometheus/prometheus/releases/download/v2.42.0/prometheus-2.42.0.linux-amd64.tar.gz
[root@server ~]# tar xf prometheus-2.5.0.linux-
amd64.tar.gz -C /usr/local/
[root@server ~]# mv /usr/local/prometheus-2.5.0.linux-
amd64/ /usr/local/prometheus
# 直接使用默认配置文件启动
[root@server ~]# /usr/local/prometheus/prometheus --
config.file="/usr/local/prometheus/prometheus.yml" &
确认端口(9090)
[root@server ~]# lsof -i:9090
通过浏览器访问http://服务器IP:9090就可以访问到prometheus的主界面
2. 在远程linux主机(被监控端agent1)上安装node_exporter组件
在4台共识节点服务器上使用如下命令安装agent, 通过配置将数据传到premetheus
[root@agent1 ~] wget https://github.com/prometheus/prometheus/releases/download/v2.42.0/prometheus-2.42.0.linux-amd64.tar.gz
[root@agent1 ~]# tar xf node_exporter-0.16.0.linux-
amd64.tar.gz -C /usr/local/
[root@agent1 ~]# mv /usr/local/node_exporter-0.16.0.linux-
amd64/ /usr/local/node_exporter
里面就一个启动命令node_exporter,可以直接使用此命令启动 [root@agent1 ~]# ls /usr/local/node_exporter/ LICENSE node_exporter NOTICE
[root@agent1 ~]# nohup /usr/local/node_exporter/node_exporter &
确认端口(9100)
[root@agent1 ~]# lsof -i:9100
通过浏览器访问http://被监控端IP:9100/metrics就可以查看到 node_exporter在被监控端收集的监控信息
3. 【添加资源监控配置】
想要监控4个节点的cpu内存等消息进行如下配置
#在主配置文件最后加上下面几行为每一台服务器自定义一个job名称配置对应的ip和端口
[root@server ~]# vim /usr/local/prometheus/prometheus.yml

4. 重启服务器
#改完配置文件后,重启服务
[root@server ~]# kill -9 $(pidof prometheus)
[root@server ~]# lsof -i:9090
[root@server ~]# nohup /usr/local/prometheus/prometheus -- config.file="/usr/local/prometheus/prometheus.yml" &
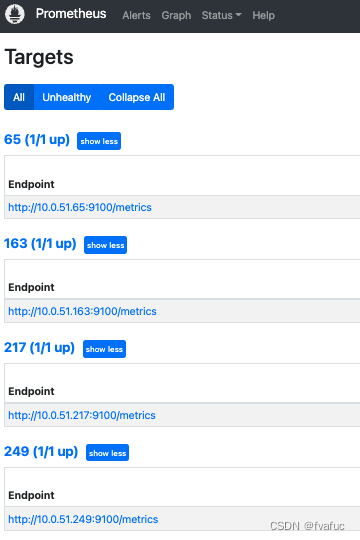
[root@server ~]# lsof -i:9090 # 确认端口被占用说 明重启成功5. 访问看到四台被监控目标
6. 安装 grafana
#安装
[root@grafana ~]# yum install grafana
#启动
[root@grafana ~]# systemctl start grafana-server
[root@grafana ~]# systemctl enable grafana-server
# 确认端口(3000)
[root@grafana ~]# lsof -i:3000
通过浏览器访问 http:// grafana服务器IP:3000就到了登录界面,使用默 认的admin用户,admin密码就可以登陆了
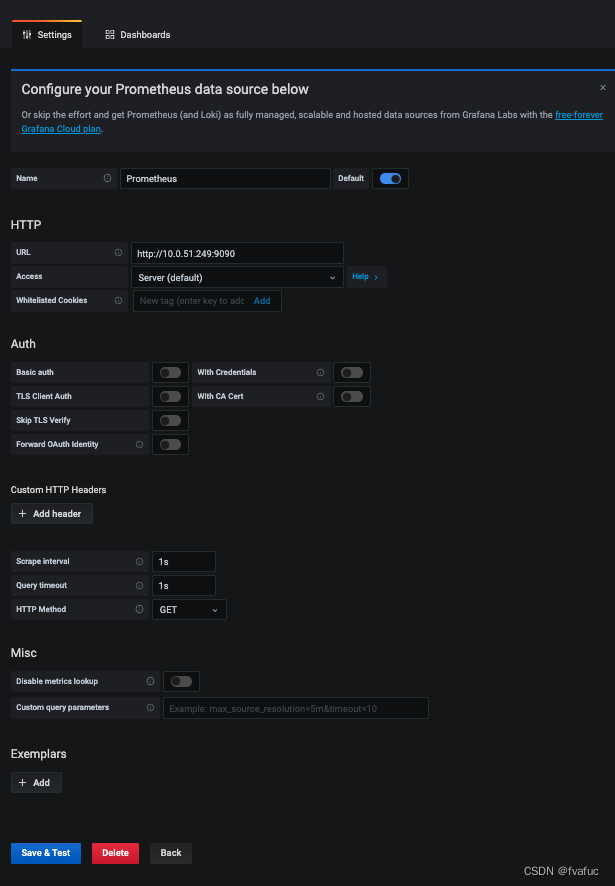
7. 为grafana添加数据源
添加数据源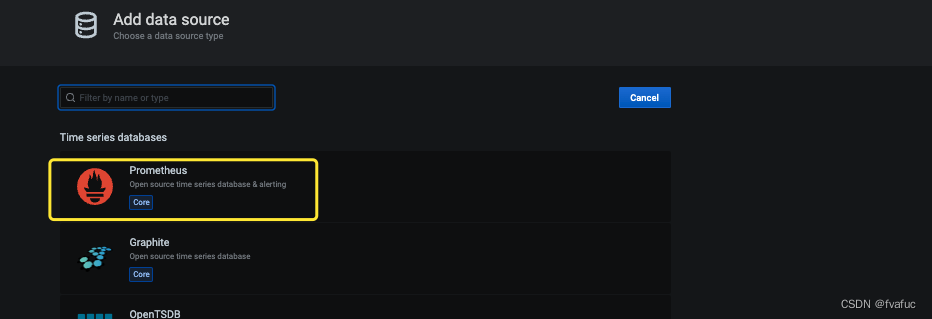
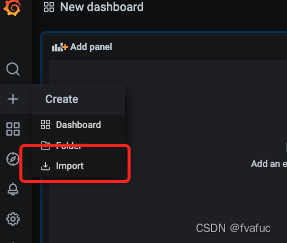
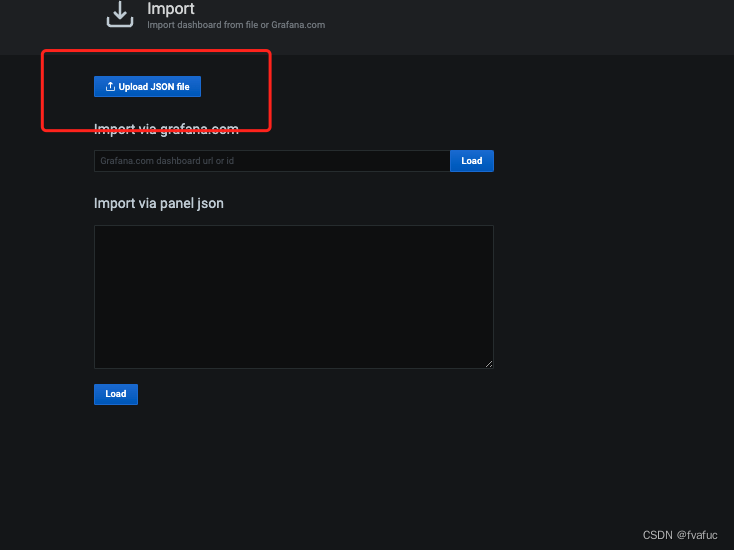
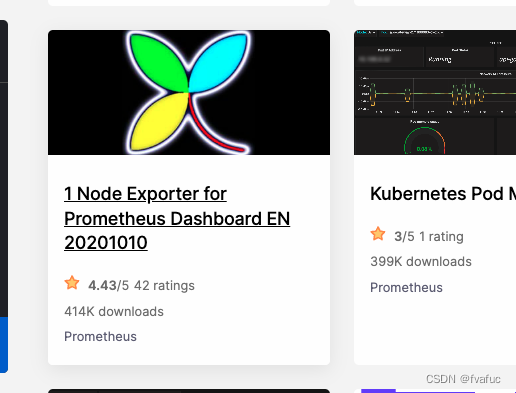
8 . 添加一个dashboard
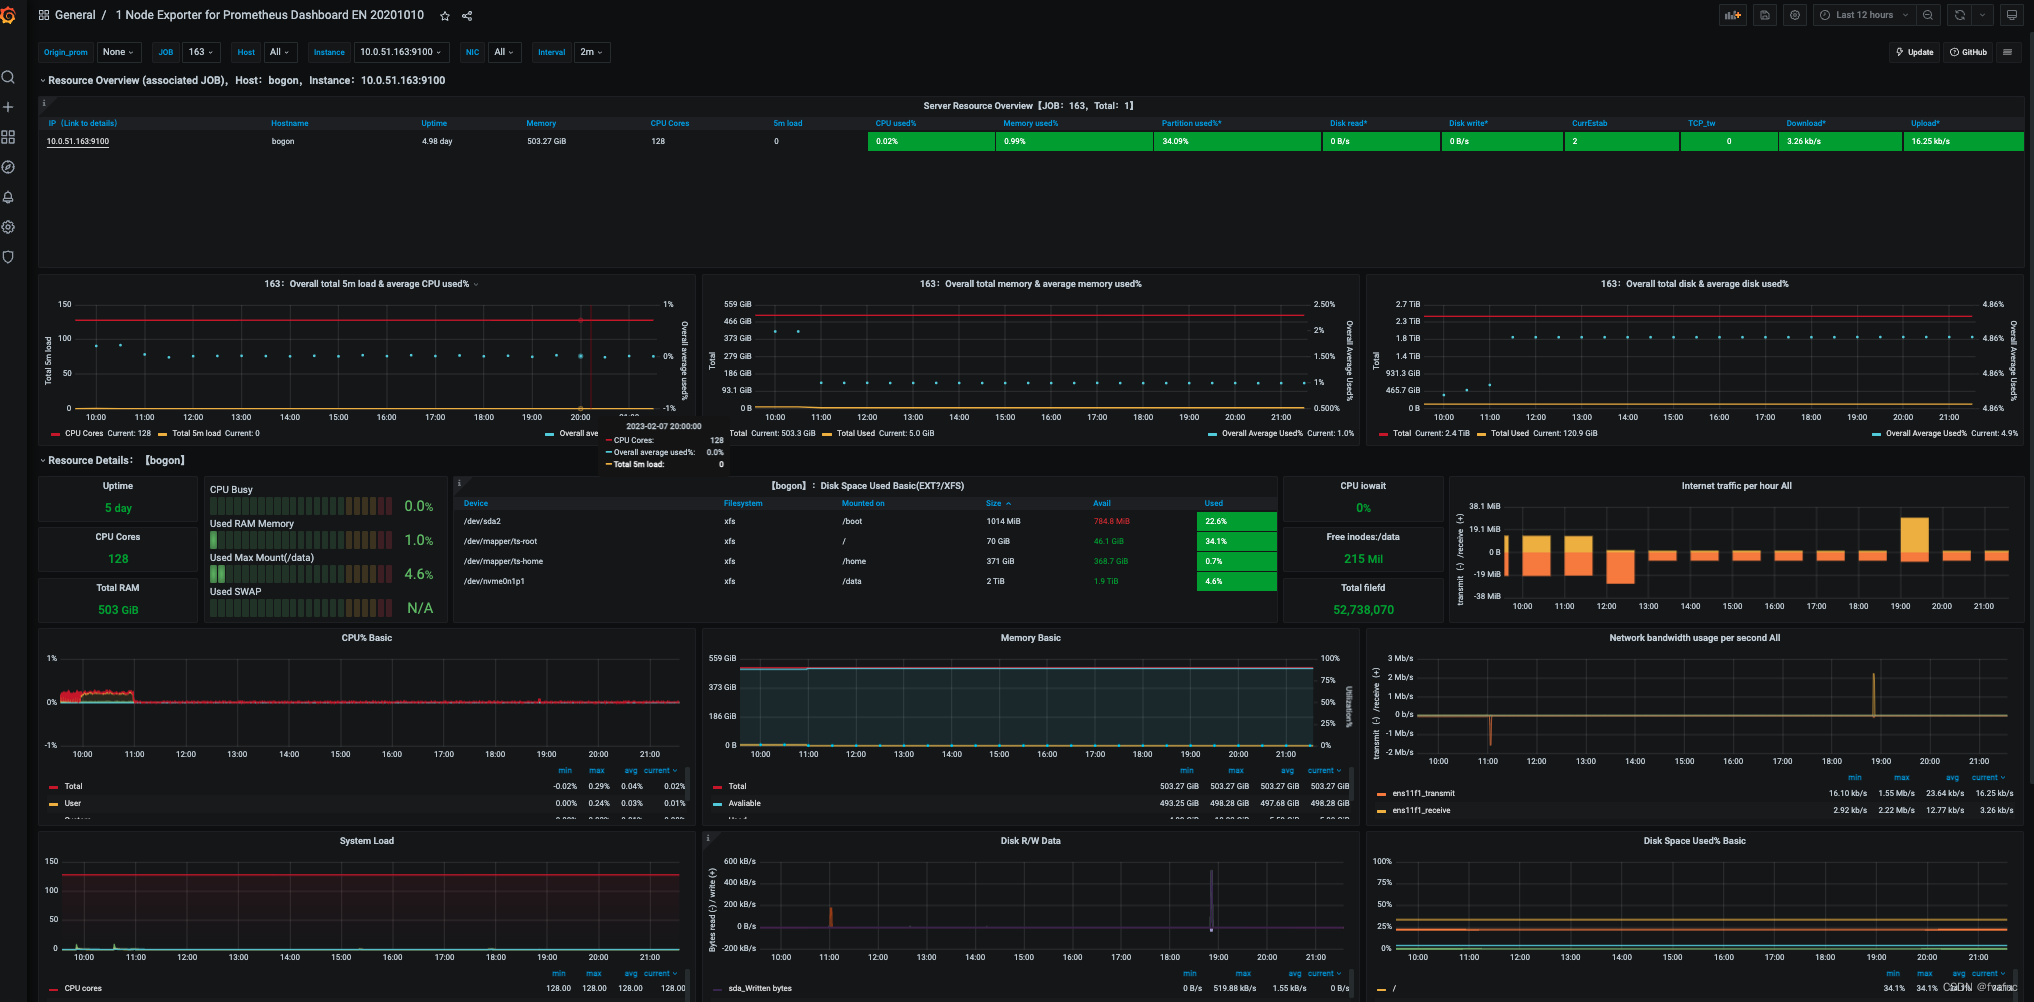
到官方找一个免费的dashboard
Dashboards | Grafana Labs
比如它
1 Node Exporter for Prometheus Dashboard EN 20201010 | Grafana Labs
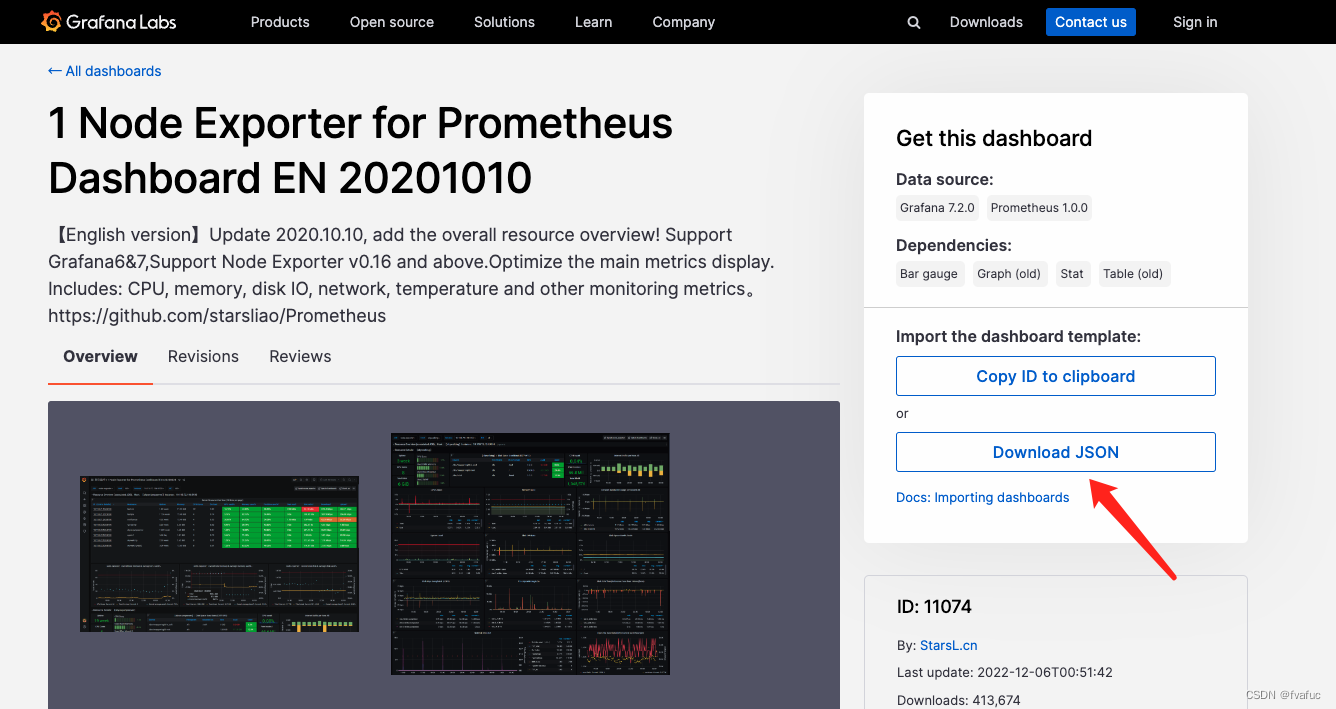
导入到我的gafana中