GEE 9:Earth Engine Reducers 的基本操作
| 阿里云国内75折 回扣 微信号:monov8 |
| 阿里云国际,腾讯云国际,低至75折。AWS 93折 免费开户实名账号 代冲值 优惠多多 微信号:monov8 飞机:@monov6 |
目录
1.Image 、ImageCollection and Regions Reducers图层和区域的相关操作
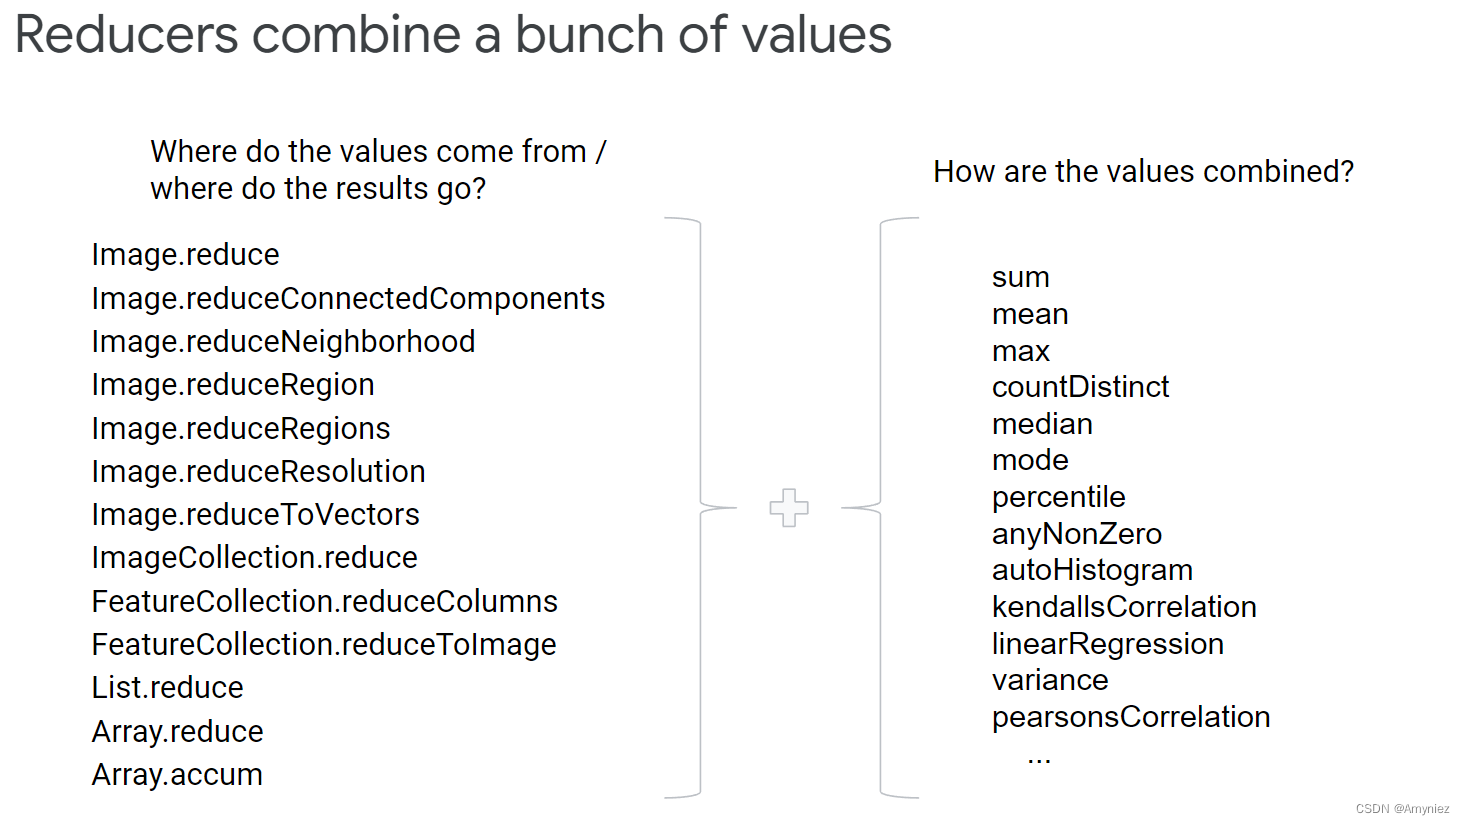
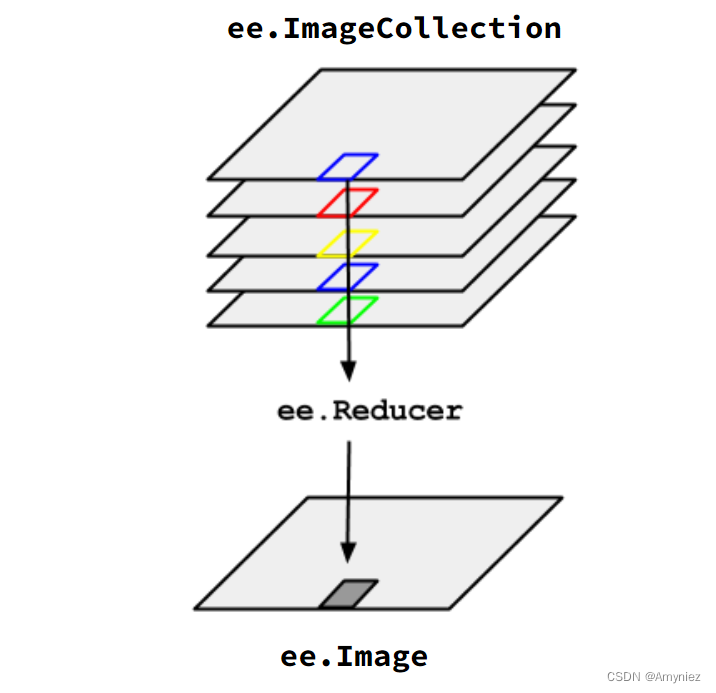
Reducers are the way to aggregate data over time, space, bands, arrays and other data structures in Earth Engine.
Reducers 是在 Earth Engine 中聚合时间、空间、波段、数组和其他数据结构的数据的方式。 ee.Reducer 类指定数据的聚合方式。此类中的Reducer可以指定用于聚合的简单统计数据最小值、最大值、平均值、中值、标准差等或输入数据的更复杂的组合例如直方图、线性回归、列表。时间处理器imageCollection.reduce()空间 处理器image.reduceRegion()、image.reduceNeighborhood()波段处理器image.reduce() FeatureCollection 的属性空间 featureCollection.reduceColumns()、以 aggregate_ 开头的 FeatureCollection 方法。
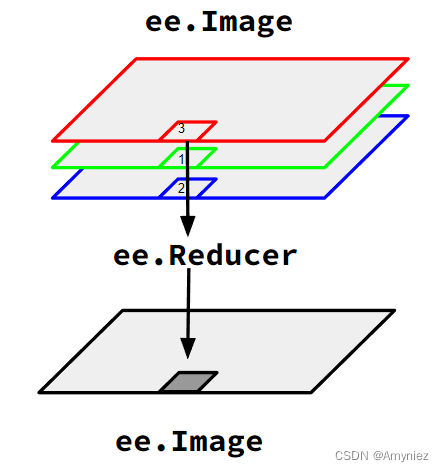
顾名思义Reducer翻译为减少器即将多个波段图像减少到一个波段图像的方法。
Reducers take an input dataset and produce a single output.
ee.Reducer()指定数据的聚合方式。
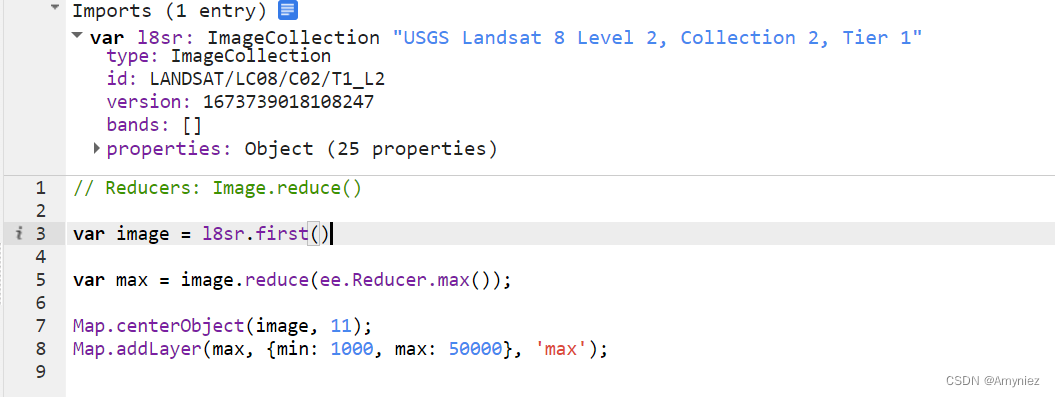
1.1 Image Reductions处理单个图层
使用 image.reduce() 对一张图像进行简化并且会对该图像的所有波段进行处理输出图像只有一个波段比如ee.Reducer.max()但是ee.Reducer.minMax()有两个波段输出。
var max = image.reduce(ee.Reducer.max());
// Reducers: Image.reduce()
var image = l8sr.first()
var max = image.reduce(ee.Reducer.max());
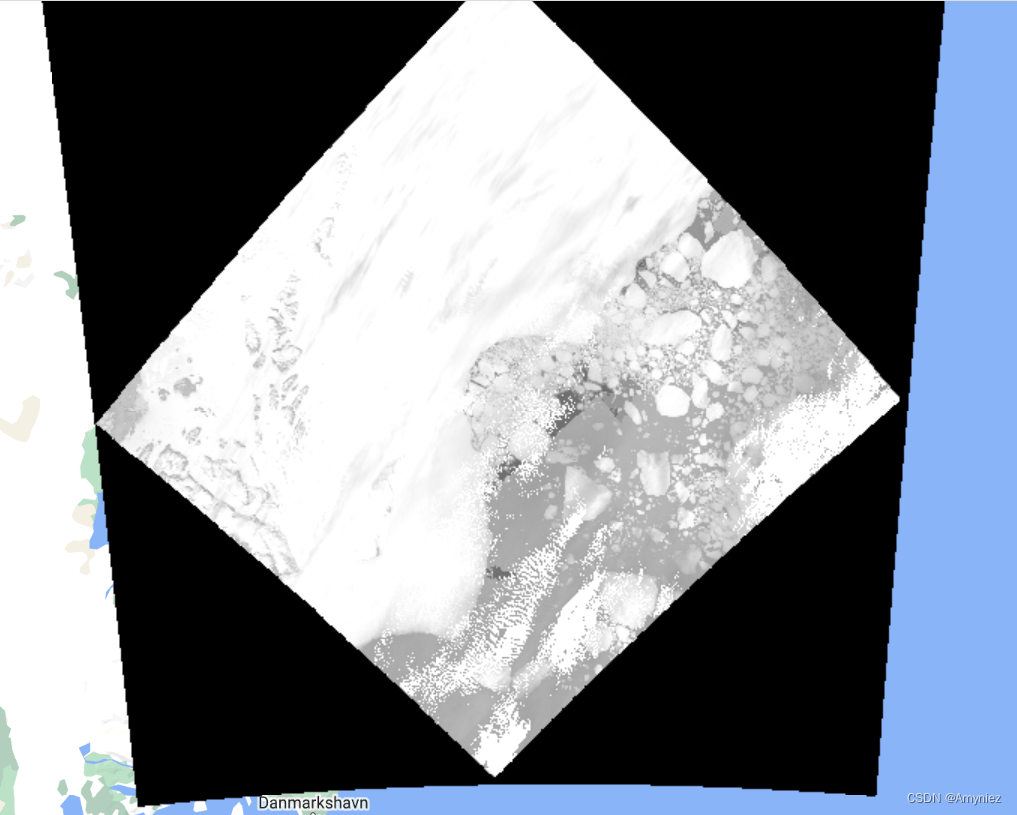
Map.centerObject(image, 11);
Map.addLayer(max, {min: 1000, max: 50000}, 'max');
结果显示
1.2 ImageCollection Reductions处理图层集
由ImageCollection表示的图像时间序列取中值输出中的每个像素由每个波段在该位置的集合中所有像素的中值组成。按照逐像素和逐波段进行计算pixel-wise、band-wise。
var median = imageCollection.reduce(ee.Reducer.median(), 2); #注意这里的2parallelScale参数
注意2 这里设置的是parallelScale用来限制内存使用的比例因子使用更大的 parallelScale例如 2 或 4可能会启用默认情况下耗尽内存的计算。
// Reducers: ImageCollection.reduce()
var median = l8sr.reduce(ee.Reducer.median(), 2);

var visParams = {
  bands: ['SR_B4_median', 'SR_B3_median', 'SR_B2_median'],
  min: 7000,
  max: 20000
}

Map.setCenter(116, 30, 8);
Map.addLayer(median, visParams, 'median');
结果显示
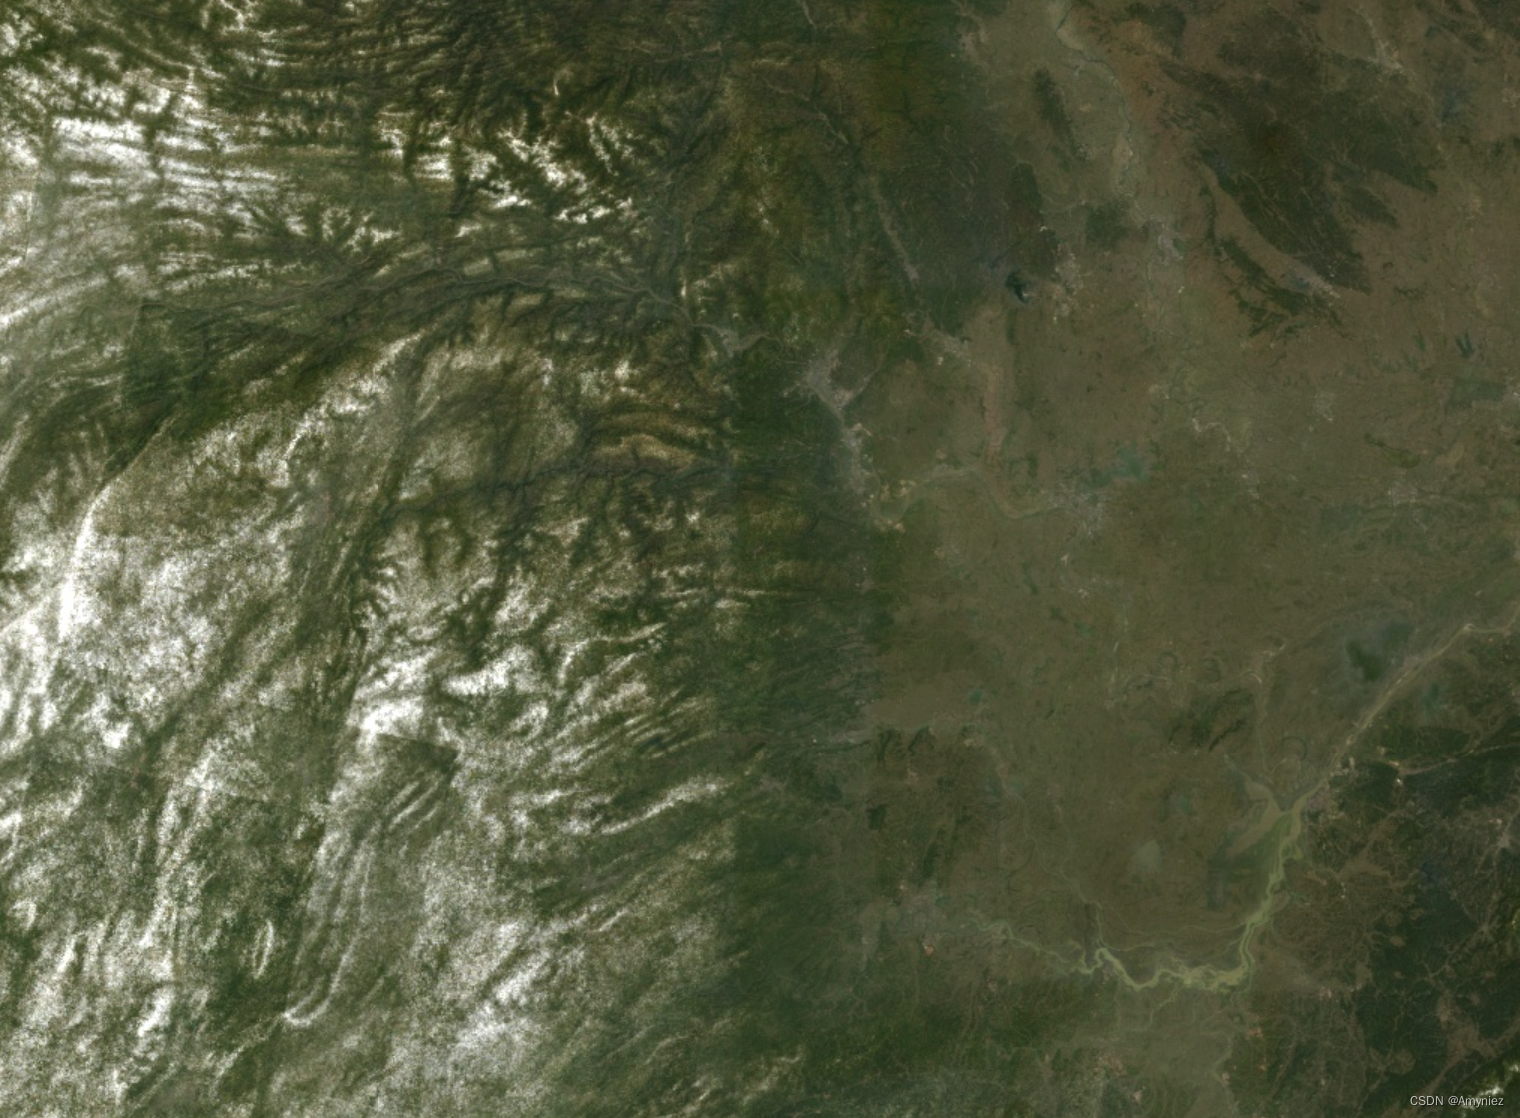
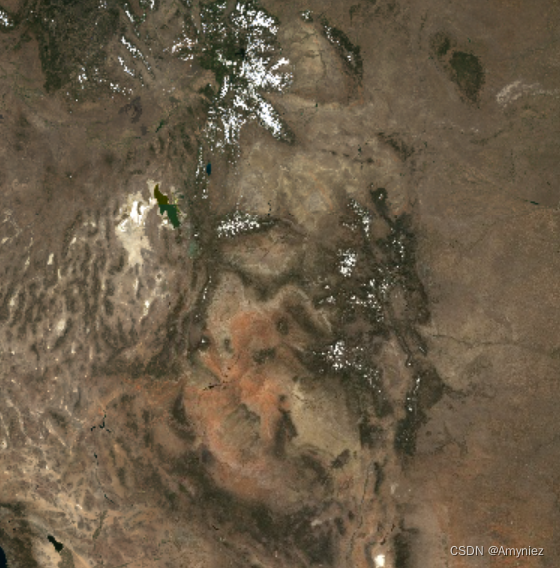
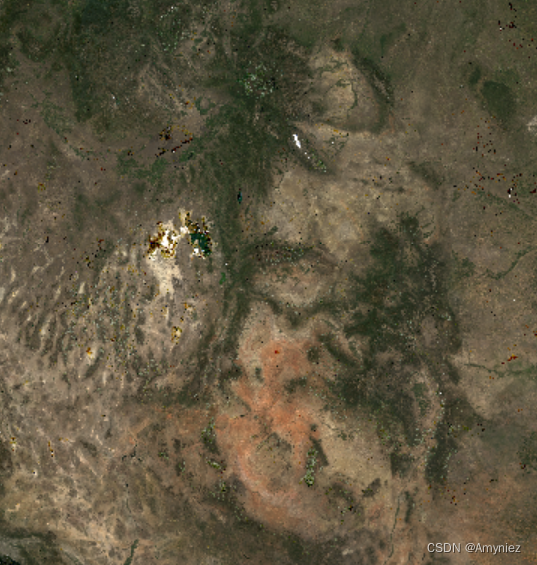
1.3 Greenest pixel (maximum NDVI) composite理解去云操作
使用Landsat8图层计算NDVI计算方法为(B5-B4)/(B5+B4)并结合B2, B3, B4。max(4) reducer 有 4 个输入4 个输出保持元组具有第一个 (NDVI) 输入的最大值将 4 个波段图像的堆叠转换为单个 4 波段图像。
计算流程
- 加载Landsat8图像并使用filterDate()选择时间时间为2020年
- 使用 maskL8sr() 函数对图层进行处理去云、去除饱和像素适当缩放波段计算并插入一个NDVI波段
- 选择 ImageCollection 的四个波段NDVI、B2、B3、B4并使用 ee.Reducer.max(4) 将它们缩小为单个图像。
// Computes a greenest-pixel composite of Landsat 8 SR images.
function maskL8sr(image) {
  var qaMask = image.select('QA_PIXEL').bitwiseAnd(parseInt('11111', 2)).eq(0);
  var saturationMask = image.select('QA_RADSAT').eq(0);

  // Apply the scaling factors to the appropriate bands.
  var opticalBands = image.select('SR_B.').multiply(0.0000275).add(-0.2);
  var thermalBands = image.select('ST_B.*').multiply(0.00341802).add(149.0);

  // Replace the original bands with the scaled ones and apply the masks.
  return image.addBands(opticalBands, null, true)
      .addBands(thermalBands, null, true)
      .addBands(image.normalizedDifference(['SR_B5', 'SR_B4']))
      .updateMask(qaMask)
      .updateMask(saturationMask);
}

// The bands we'll have in our composite, with the NDVI band first.
var bands = ['nd', 'SR_B2', 'SR_B3', 'SR_B4'];

var imgs = l8sr.filterDate('2020-01-01', '2020-12-31');

// Use setOutputs() to keep the band names (otherwise they're
// placed with "max", "max2", "max3", etc.).
var greenestPixel =
      imgs.map(maskL8sr)
          .select(bands)
          .reduce(ee.Reducer.max(4).setOutputs(bands));

var visParams = {
  bands: ['SR_B4', 'SR_B3', 'SR_B2'],
  min: 0,
  max: 0.5,
  gamma: 1.4,
};

Map.addLayer(greenestPixel, visParams);

// Optionallly display a simple median composite for comparison.
Map.addLayer(imgs.map(maskL8sr).median(), visParams, 'median');
语法注释
- parseInt(‘11111’, 2)强制转换将’11111’这个2进制数字转化成了十进制数字31。
- bitwiseAnd() 即“按位与”对应的两个二进位都为1时结果位才为1如十进制位的60110和101010结果为0010。
- .eq(0) 是将影像中等于0的像素变为1其它像素变为0。
去云操作
- 第一步选取影像的 ‘QA_PIXEL’ 波段
- 第二步对其中的每一个像素和 ‘0000 0000 0001 1111’ 进行按位与运算不到16位就往左补0
- 第三步将值等于0的像素变为1其它像素变为0。我们不难看出第二步中只有’XXXX XXXX XXX0 0000’X代表0或1这样的像素在进行位运算后的结果为0最终的结果为1。结合第一步中展示的表格我们最终得到的影像中值为0的像素就是函数中注释提到的需要筛去的像素。
结果显示
median
maxNDVI
1.4 ImageCollection reductions注意事项
这些 reducer 在 ImageCollection.reduce() 中不起作用因为它们没有数字输出
ee.Reducer.frequencyHistogram()
ee.Reducer.histogram()
ee.Reducer.toList()
如果不首先将每个输入转换为一维数组这些缩减器将无法在 ImageCollection.reduce() 中工作
ee.Reducer.covariance()
ee.Reducer.centeredCovariance()
1.5 Image Region reductions
var mean = image.reduceRegion({
  reducer: ee.Reducer.mean(),
  geometry: santaCruz.geometry(),
  scale: 30,
  maxPixels: 1e9,
});
解释
reducer: 需要使用的 reducer
geometry: 数据范围
scale: 每个像素的分辨率
crs: 投影如果没有则设置为图像第一个波段的投影
maxPixels: 图像最大像素数量。默认为10,000,000个. 这是防止意外运行大量计算的保护机制。
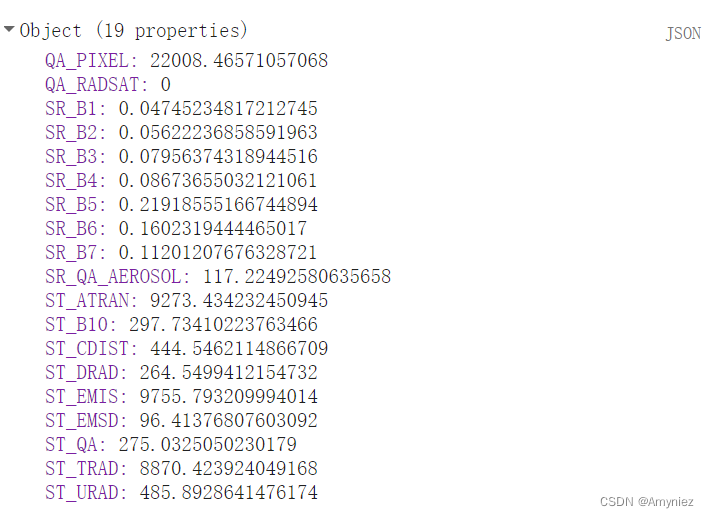
// Reducers: Image.reduceRegion()
var santaCruz = counties.filter(ee.Filter.eq('NAME', 'Santa Cruz')).first();

var image = l8sr.filterBounds(santaCruz.geometry()).first()

var mean = image.reduceRegion({
  reducer: ee.Reducer.mean(),
  geometry: santaCruz.geometry(),
  scale: 30,
  maxPixels: 1e9,
});

print(mean)
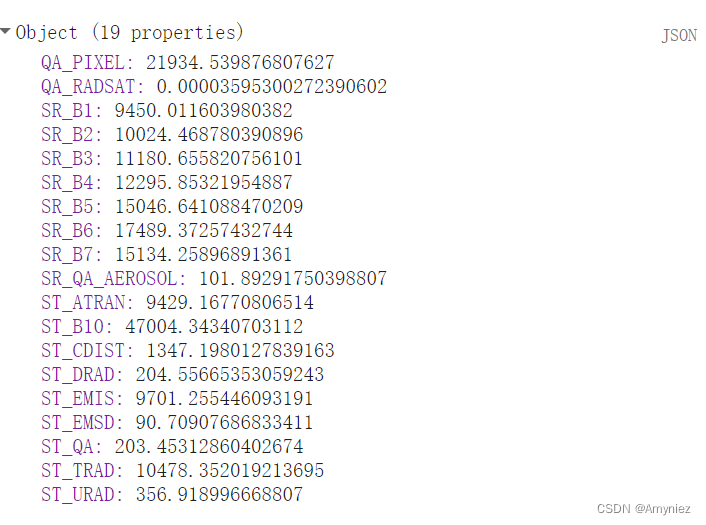
The result is a set of <band, band_mean> tuples.
1.6 Image Region reductions, cont.
var meanDictionary = composite.reduceRegion({
  reducer: ee.Reducer.mean(),
  geometry: region.geometry(),
  scale: 30,
  maxPixels: 1e10,
  tileScale: 4
});
此示例使用更大的 maxPixels 值以及使用 tileScale 参数。tileScale 是一个介于 0.1 和 16默认为 1之间的比例因子用于调整聚合切片大小。设置较大的 tileScale例如 2 或 4会使用较小的图块并且可能会启用默认情况下耗尽内存的计算。类似于并行计算将需要计算的图层分为2^n个
提示
- 计算被分成每个像素的子计算每个子计算都可以由不同的服务器完成。
- 增加 tileScale 会使每台服务器的计算量更小从而减少每台服务器内存不足的可能性。
- 注意 将计算拆分为更多像素的设置时间可能会使整体计算花费更长的时间。
// See:
// https://code.earthengine.google.com/?scriptPath=Examples%3ACloud%20Masking%2FLandsat8%20Surface%20Reflectance
function maskL8sr(image) {
  // Bit 0 - Fill
  // Bit 1 - Dilated Cloud
  // Bit 2 - Cirrus
  // Bit 3 - Cloud
  // Bit 4 - Cloud Shadow
  var qaMask = image.select('QA_PIXEL').bitwiseAnd(parseInt('11111', 2)).eq(0);
  var saturationMask = image.select('QA_RADSAT').eq(0);

  // Apply the scaling factors to the appropriate bands.
  var opticalBands = image.select('SR_B.').multiply(0.0000275).add(-0.2);
  var thermalBands = image.select('ST_B.*').multiply(0.00341802).add(149.0);

  // Replace the original bands with the scaled ones and apply the masks.
  return image.addBands(opticalBands, null, true)
      .addBands(thermalBands, null, true)
      .updateMask(qaMask)
      .updateMask(saturationMask);
}

var collection = ee.ImageCollection('LANDSAT/LC08/C02/T1_L2')
                     .filterDate('2020-01-01', '2021-01-01')
                     .map(maskL8sr);

var composite = collection.median();


// Load an input region: Sierra Nevada.
var region = ee.Feature(ee.FeatureCollection('EPA/Ecoregions/2013/L3')
  .filter(ee.Filter.eq('us_l3name', 'Sierra Nevada'))
  .first());

// Reduce the region. The region parameter is the Feature geometry.
var meanDictionary = composite.reduceRegion({
  reducer: ee.Reducer.mean(),
  geometry: region.geometry(),
  scale: 30,
  maxPixels: 1e10,
  tileScale: 4
});

// The result is a Dictionary.  Print it.
print(meanDictionary);
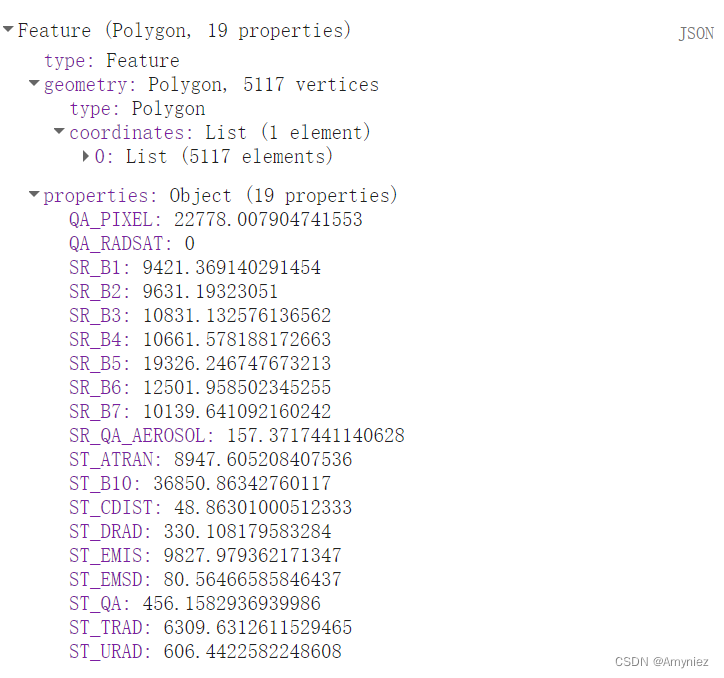
1.7 Image RegionS reductions
var featuresWithMeans = image.reduceRegions({
  collection: maineCounties,
  reducer: ee.Reducer.mean(),
  scale: 30,
  tileScale: 4
});
// Load a FeatureCollection of counties in Maine.
var maineCounties = ee.FeatureCollection('TIGER/2016/Counties')
  .filter(ee.Filter.eq('STATEFP', '23'));

var image = l8sr
    .filterBounds(maineCounties)
    .filterDate('2020-01-01', '2020-12-31')
    .median()

// Add reducer output to the Features in the collection.
var maineMeansFeatures = image.reduceRegions({
  collection: maineCounties,
  reducer: ee.Reducer.mean(),
  scale: 30,
  tileScale: 2
});

// Print the first feature, to illustrate the result.
print(ee.Feature(maineMeansFeatures.first()).select(image.bandNames()));
使用 reduceRegions() 执行图像区域缩减。返回输入特征每个特征都增加了相应的 reducer 输出。
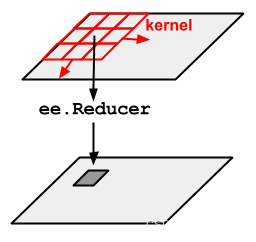
2. Image Neighborhood reductions (convolution)卷积Kernel
// Reducers: Image.reduceNeighborhood()
// Region in the redwood forest
var redwoods = ee.Geometry.Rectangle(-124.0665, 41.0739, -123.934, 41.2029);
// Input NAIP imagery
//National Agriculture Imagery Program (NAIP) ImageCollection
var naipCollection = ee.ImageCollection('USDA/NAIP/DOQQ')
.filterBounds(redwoods)
.filterDate('2012-01-01', '2012-12-31');
var naip = naipCollection.mosaic();
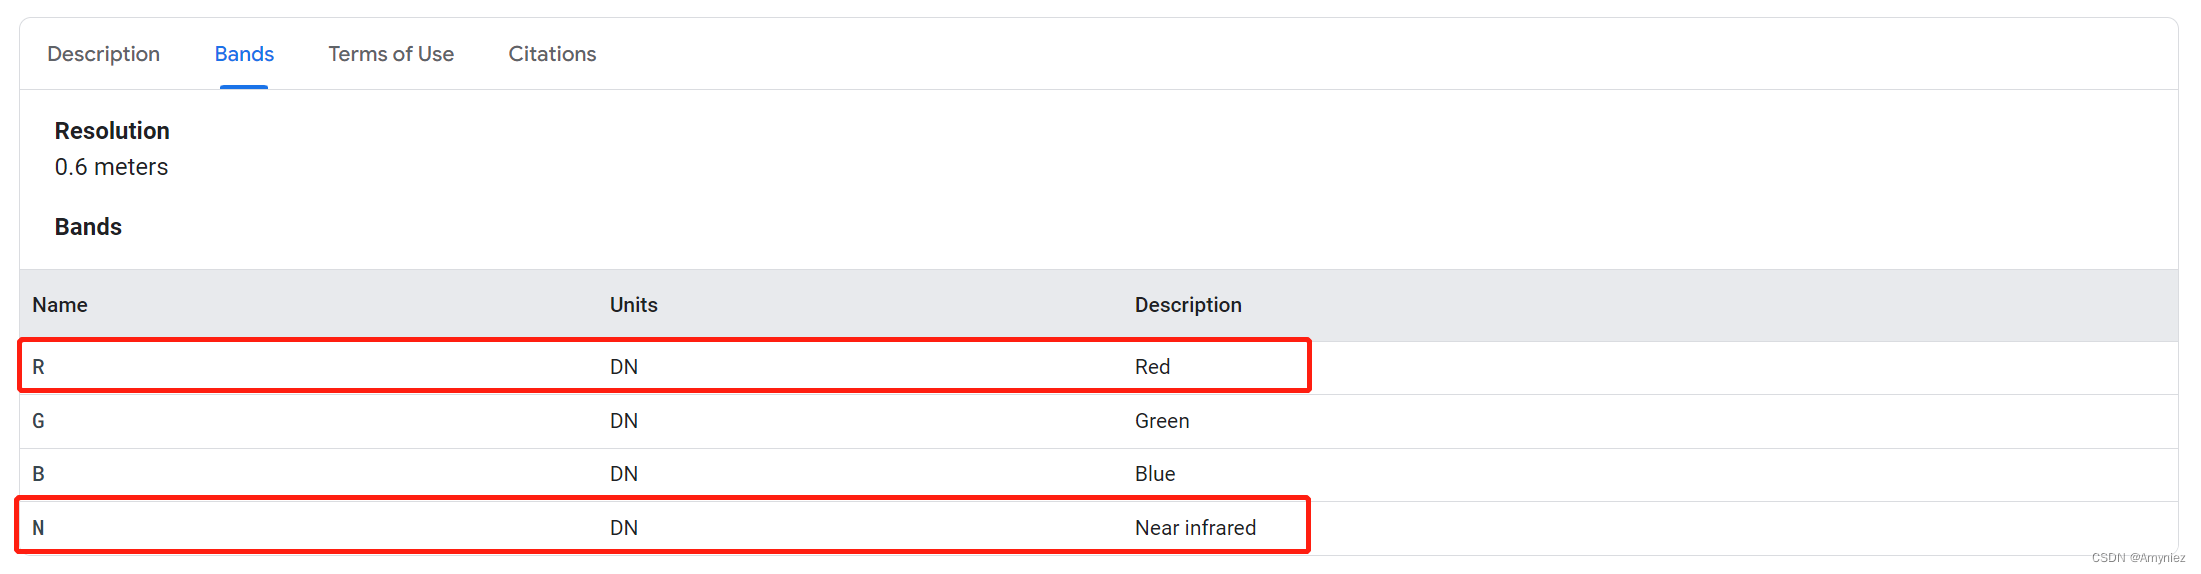
// Compute NDVI from the NAIP
var naipNDVI = naip.normalizedDifference(['N', 'R']);
// Standard Deviation (SD) as texture of NDVI
// a circle kernel of radius 7 pixels
var texture = naipNDVI.reduceNeighborhood({
reducer: ee.Reducer.stdDev(),
kernel: ee.Kernel.circle(7),
});
// Display
Map.centerObject(redwoods, 12);
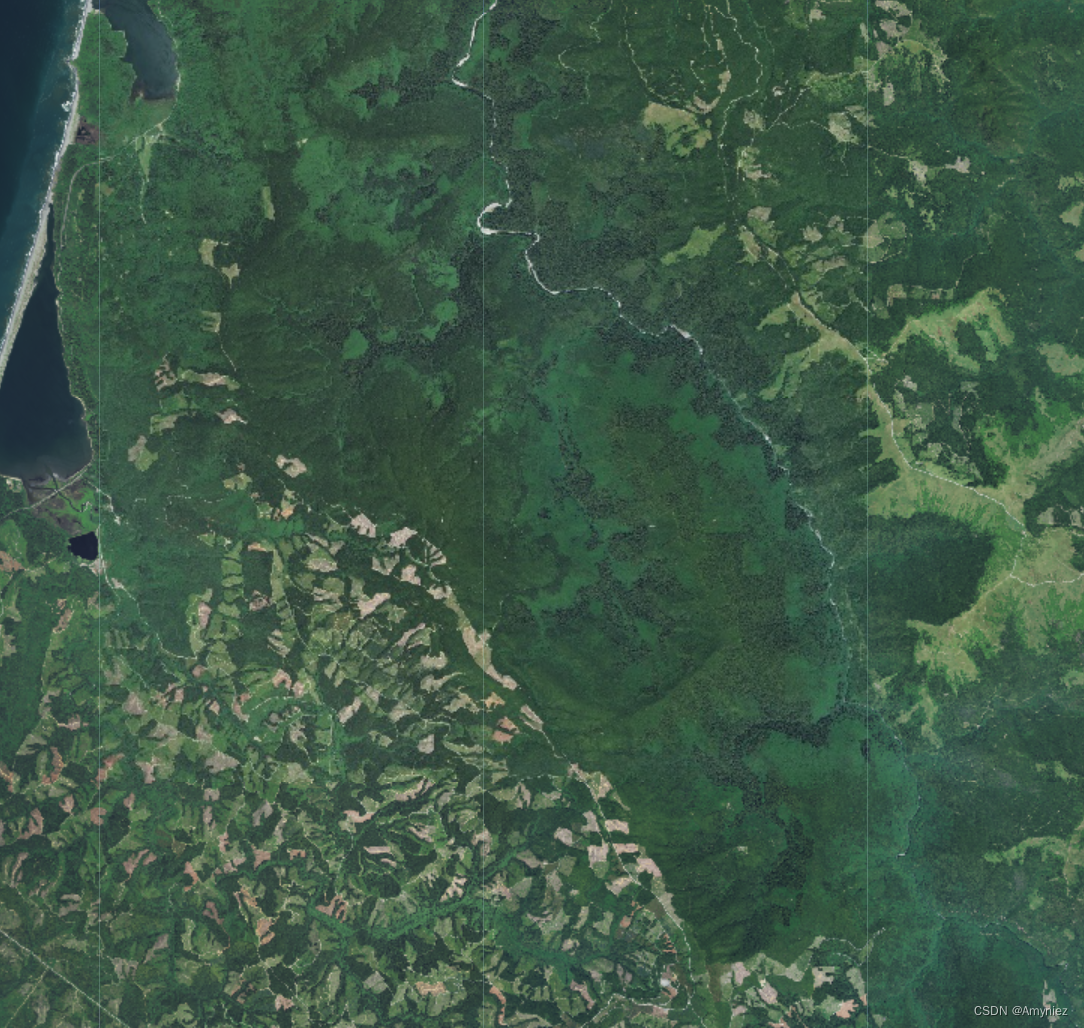
Map.addLayer(naip, {}, 'NAIP input imagery');
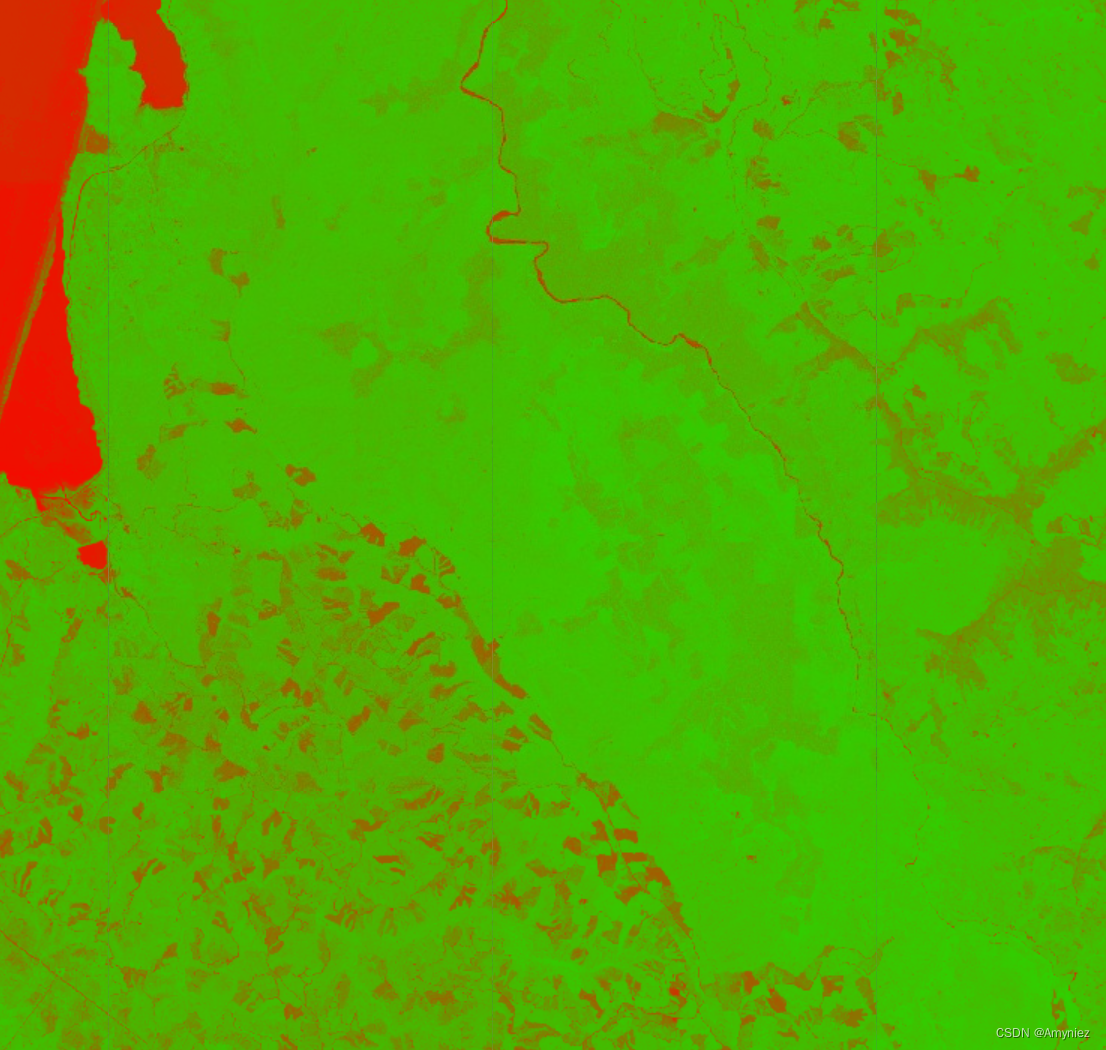
Map.addLayer(naipNDVI, {min: -1, max: 1, palette:['FF0000', '00FF00']}, 'NDVI');
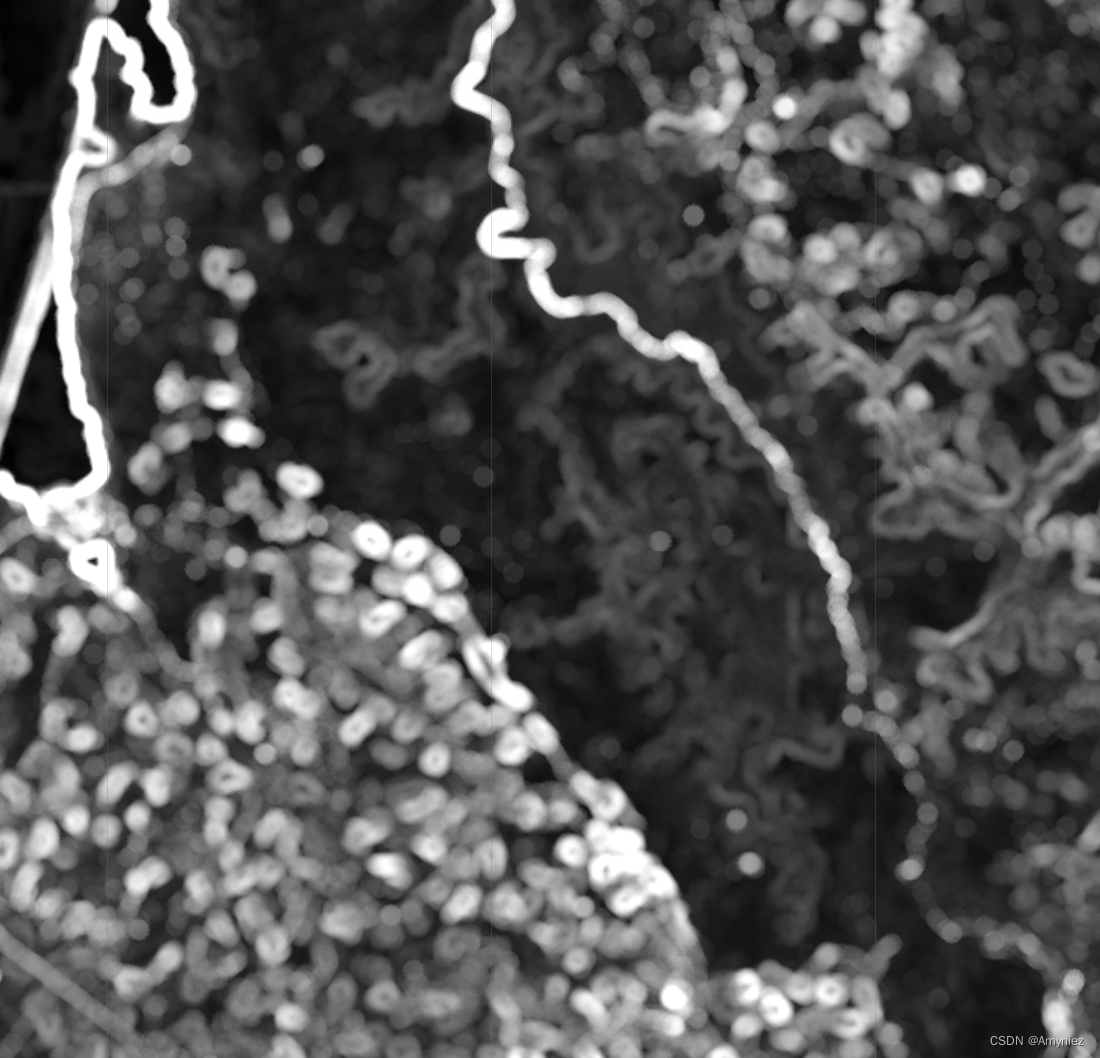
Map.addLayer(texture, {min:0, max: 0.3}, 'SD of NDVI');
NAIP:
NDVI:
SD表示NDVI的纹理
3.FeatureCollection column reductions属性运算

脚本流程
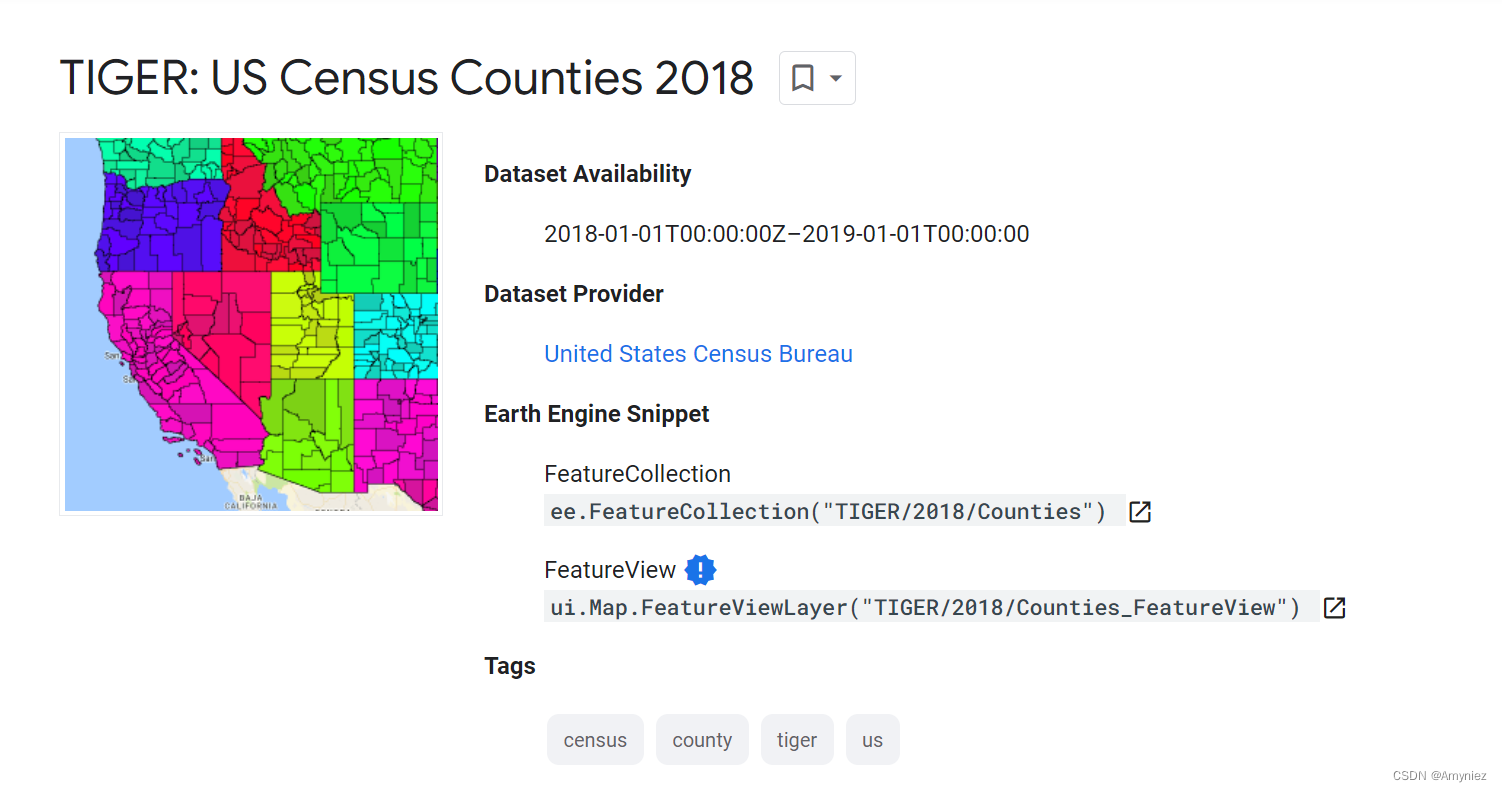
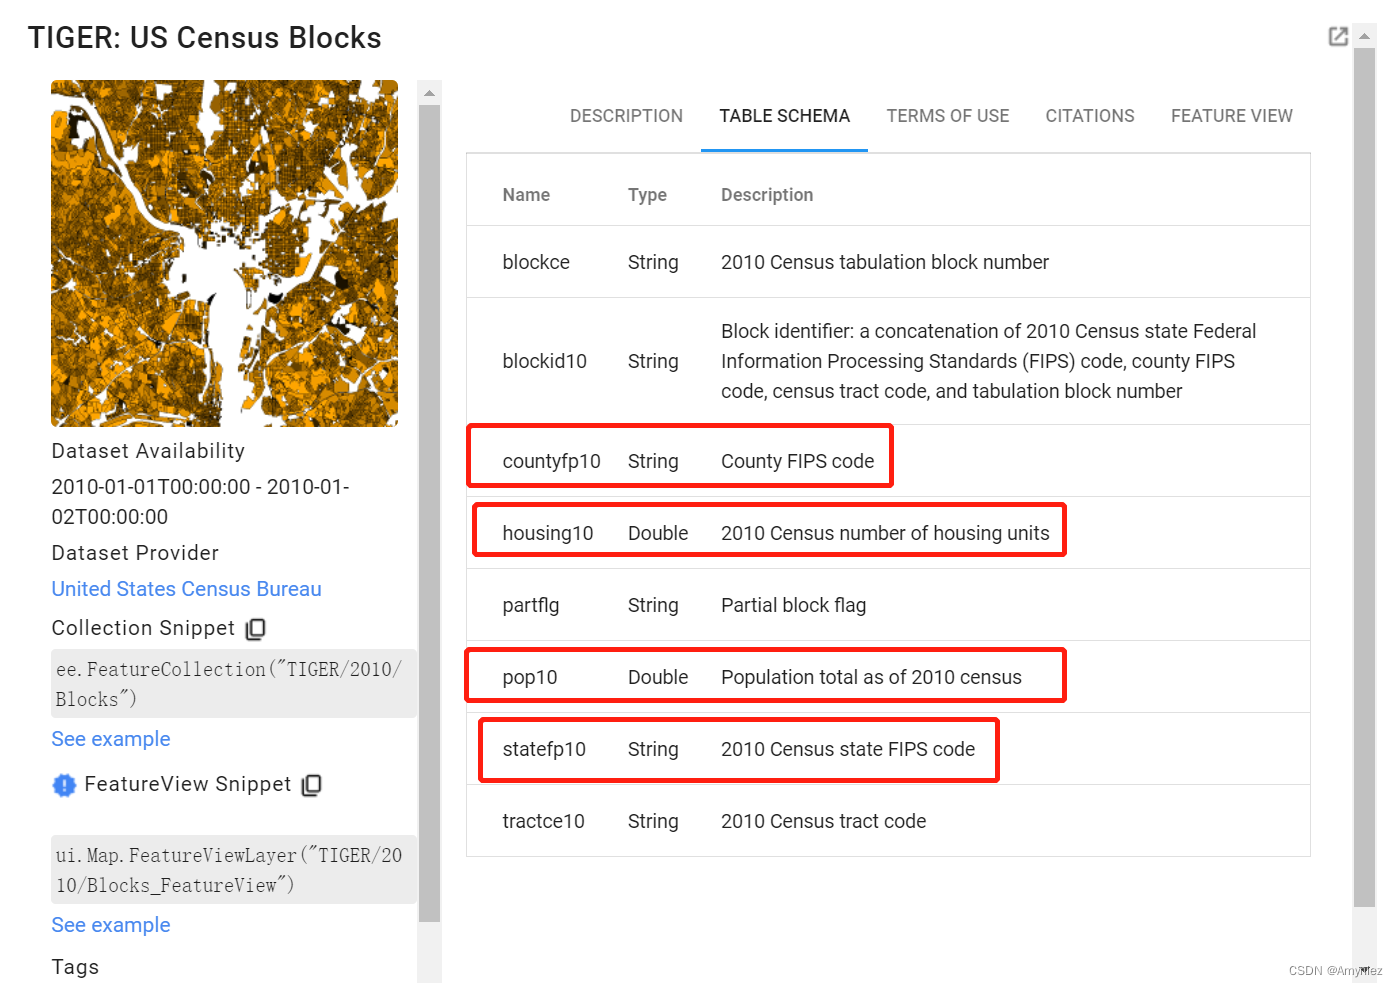
1.加载美国人口普查数据并在Benton County选择需要的属性
2.选择人口和房屋单元两个属性
3.实现reduceColumn操作selectors设置为人口和房屋单元属性reducer设置为ee.Reducer.sum().repeat(2)。
Notes: Unlike imageCollection.reduce(), in which reducers are automatically repeated for each band, reducers on a FeatureCollection must be explicitly repeated using repeat(). Specifically, repeat the reducer m times for m inputs.
// Consider a FeatureCollection of US census blocks with census data as attributes.
// The variables of interest are total population and total housing units.
// You can get their sum(s) by supplying a summing reducer argument to
// reduceColumns() and printing the result.
// Load US cenus data as a FeatureCollection.
var census = ee.FeatureCollection('TIGER/2010/Blocks');
// Filter the collection to include only Benton County, OR.
var benton = census.filter(
ee.Filter.and(
ee.Filter.eq('statefp10', '41'),
ee.Filter.eq('countyfp10', '003')
)
);
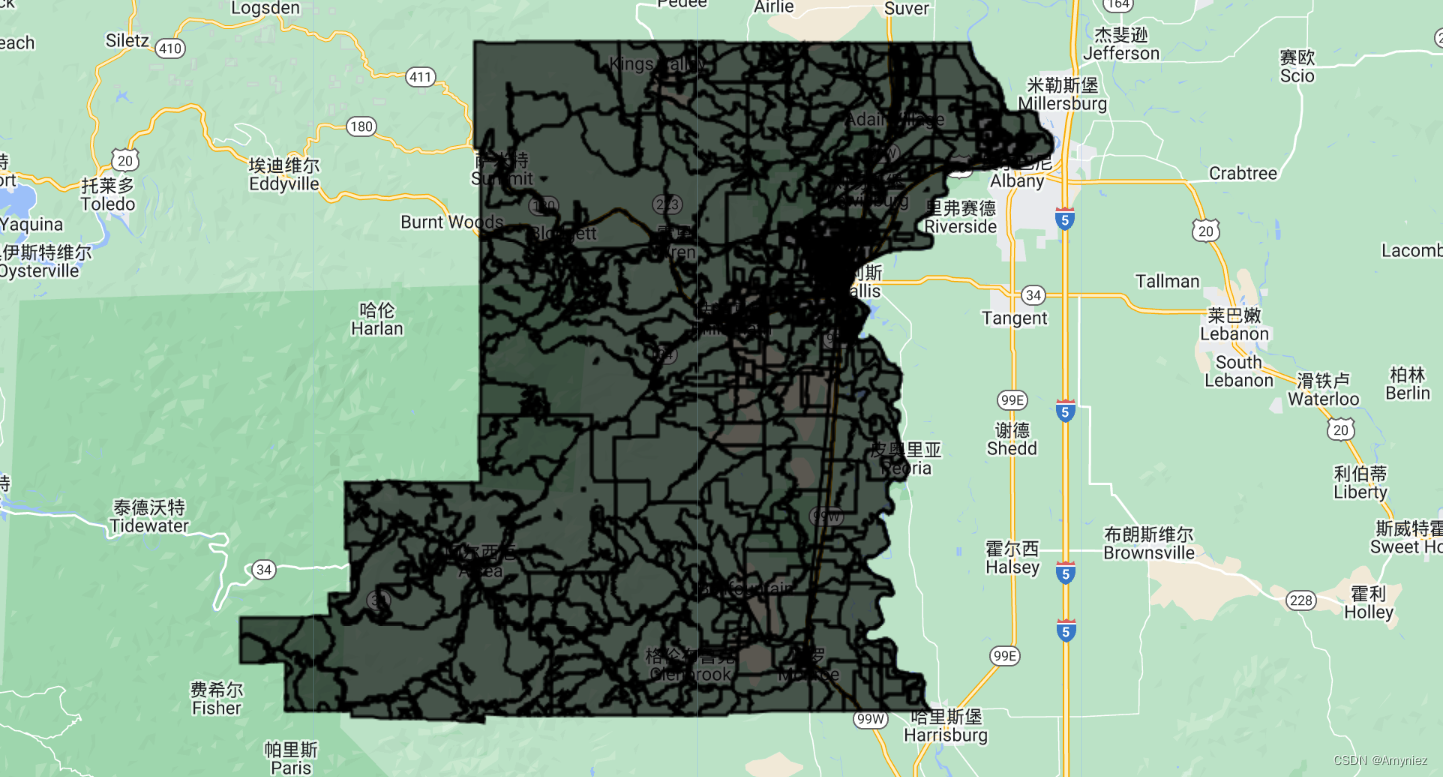
// Display Benton County cenus blocks.
Map.setCenter(-123.27, 44.57, 13);
Map.addLayer(benton);
// Compute sums of the specified properties.
var properties = ['pop10', 'housing10'];
var sums = benton
.filter(ee.Filter.notNull(properties))
.reduceColumns({
reducer: ee.Reducer.sum().repeat(2),
selectors: properties
});
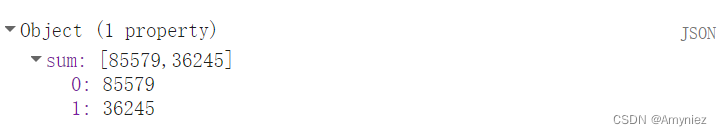
// Print the resultant Dictionary.
print(sums);
结果显示