

【计算几何】向量叉积和凸包 | 引射线法 | 判断点是否在多边形内部 | 葛立恒扫描法 | Cross Product and Convex Hul
| 阿里云国内75折 回扣 微信号:monov8 |
| 阿里云国际,腾讯云国际,低至75折。AWS 93折 免费开户实名账号 代冲值 优惠多多 微信号:monov8 飞机:@monov6 |
 猛戳跟哥们一起玩蛇啊 👉 《一起玩蛇》🐍
💭 写在前面这个系列似乎反响不错 所以我继续水下去 bushi。本篇博客是关于经典的 Cross Product and Convex Hull 向量叉积和凸包的我们将介绍引射线法葛立恒扫描法。在讲解之前我会对前置知识做一个简单的介绍比如向量叉积如何确定直线是在顺时针上还是逆时针上等。算法讲解部分是为后面练习题做准备的比如如何判断内点是否在多边形内如何计算多边形面积等还将简单介绍一下葛立恒扫描法在提供的练习题中就能碰到。练习代码量200行左右如果感兴趣想尝试做的话需要有一定的耐心。练习题的环境为 Google ColaboratoryK80 GPUJupyter Notebookcolab
Ⅰ. 前置知识
0x00 向量叉积Cross product
📚 概念向量积 (Cross product)也可以称之为 "向量叉积" 。我更愿意称之为 "向量叉积"因为可以顾名思义 —— 叉积交叉乘积
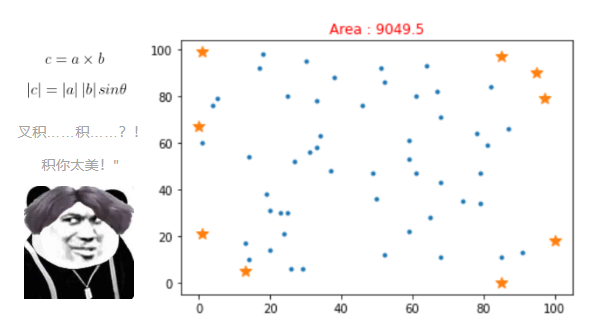
" 叉积叉积……积…… 积你太美"
 咳咳…… 它是一种在向量空间中向量的二元运算。
向量叉积不同于点积其运算结果是一个向量而非标量。
并且两个向量的叉积与这两个向量垂直。表示方法为 期中
代表向量。
💭 定义如下
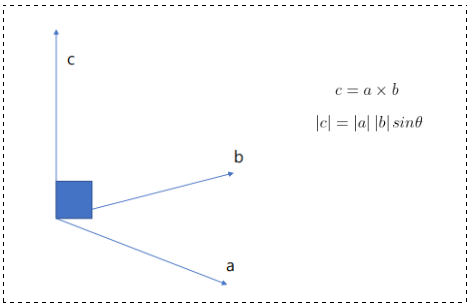
模长这里的 表示两向量之间的夹角共起点的前提下范围
它位于这两个矢量所定义的平面上。
方向a向量与b向量的向量积的方向与这两个向量所在平面垂直且遵守右手定则。
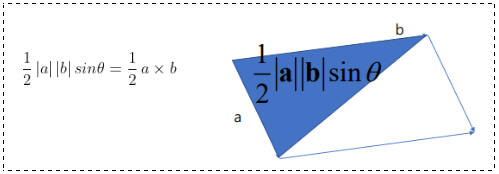
的长度在数值上等于以
夹角为
组成的平行四边形面积。
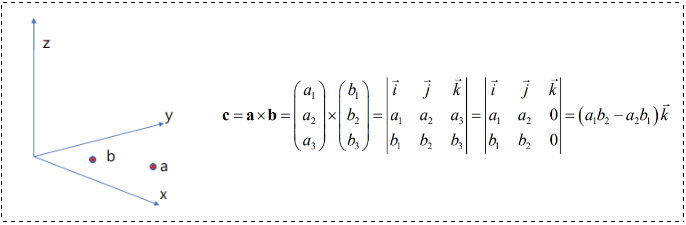
- 因为在不同的坐标系中
两向量的三角形的面积
令向量 和
都在平面
上
0x01 确定顺时针逆时针Clockwise or Counter-clockwise
❓ 有什么好办法可以确定点在直线 是在顺时针上还是逆时针上
 我们可以用 叉积 "暗中观察" 点是否在直线
 的顺时针或逆时针方向上
- ∵
的叉积指向显示的前方∴
点在逆时针方向。
- ∵
的叉积指向显示的后方∴
点在顺时针方向。
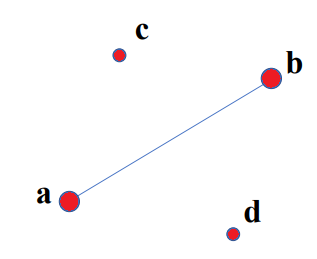
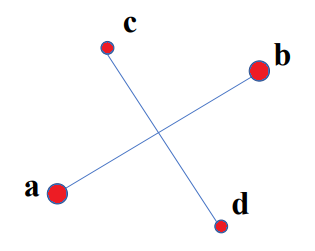
0x02 交叉点Intersection
 当每条线的端点位于另一条线的不同侧面时两条线就会交叉
Ⅱ. 算法讲解部分
0x00 判断内点是否在多边形内Inner points
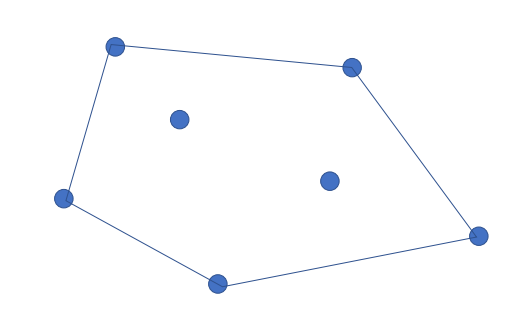
❓ 思考如何检查平面上的一个点point是否在多边形内部
这里我介绍两种常用的方法只在一侧法 和 引射线法。
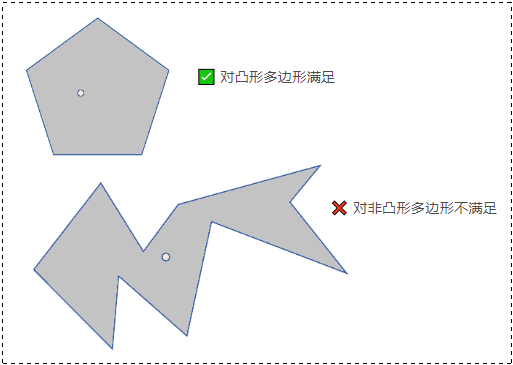
① "只在一侧" 法
只在一侧 (only on the one side) 当一个点在每个多边形边的一侧顺时针或逆时针时该点就在多边形的内部。
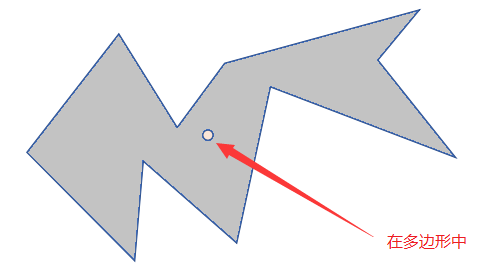
② 引射线法
从目标点出发引一条射线观察这条射线和多边形所有边的交点数目。如果有奇数个交点则说明在内部如果有偶数个交点则说明在外部。
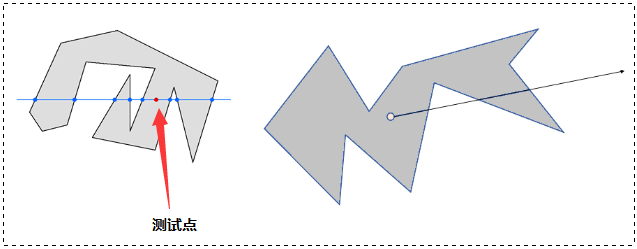
图中的红点是需要测试的点我已标出我们要确定它是否位于多边形内。
💡 解决方案将多边形的每一边与测试点的
垂直坐标进行比较并编译一个结点列表其中每个节点是一个边与测试点的
在本示例中测试点左侧有5个节点右侧有3个节点。由于 5 和 3 是奇数该测试点在多边形内。注意该算法不关心多边形是顺时针还是逆时针跟踪
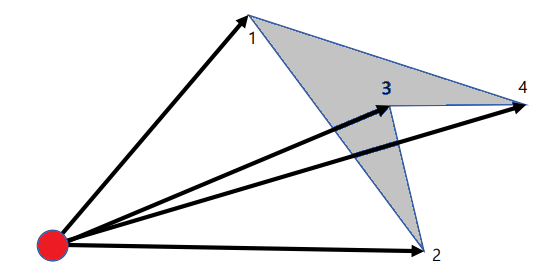
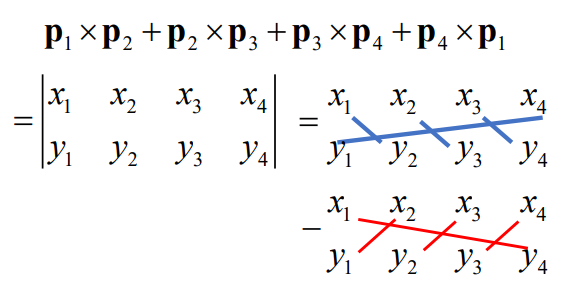
0x01 计算多边形的面积
💡 思路
- 按逆时针方向对顶点进行排序。
- 找到
个顶点位于第
个节点和第
个节点的边缘的顺时针方向的三角形并积累三角形的面积。
- 删除三角形并再次重复该过程直到没有顶点为止。
将所有边缘的叉积加起来然后除以2。
sum += float(x1 * y2 - x2 * y1);根据一条边的方向添加或减去三角形的面积。
 令人惊讶的是只留下了多边形的面积
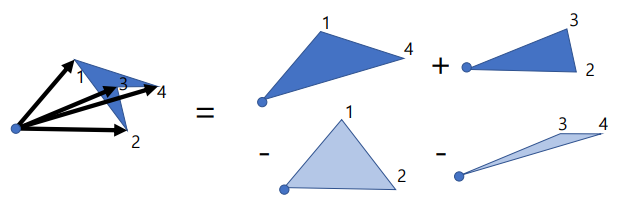
🔑 提示其类似于边的叉积之和
0x02 葛立恒扫描法Graham Scan
凸包计算Computing a convex hull给定平面点
葛立恒扫描法Graham Scan
葛立恒扫描法Graham's scan是一种计算一组的平面点的凸包的算法。以在1972年发表该算法的葛立恒命名。
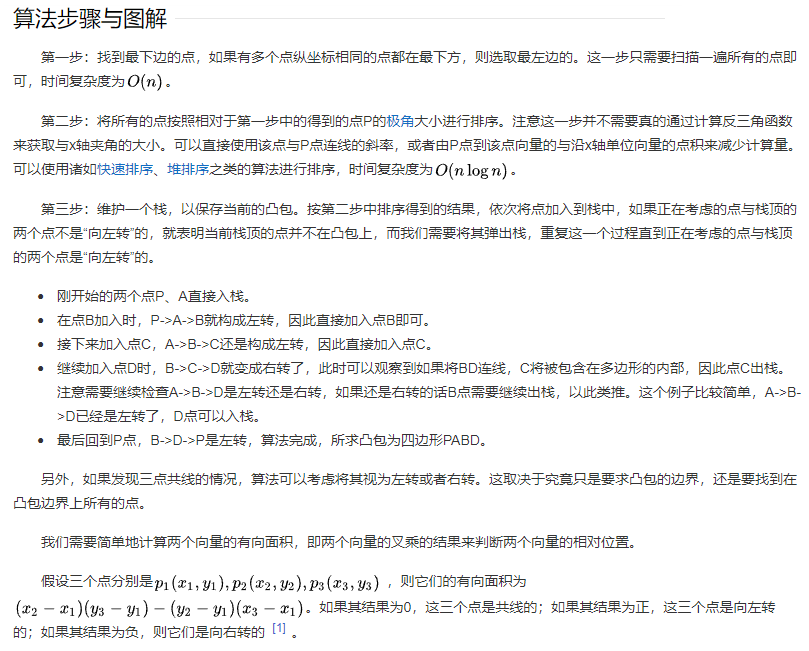
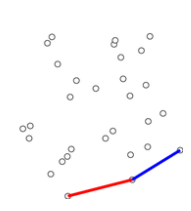
- 先找到左下角的点
一定在凸包上。
- 以
入栈从
第三个点开始若
的左边 则
出栈一直遍历完后面所有点 这里就需要向量叉乘来判断点在线的左边还是右边。
- 最后留在栈中的点就是凸包上的点。
Ⅲ. 练习Assignment
🔺 注意需用 Python 实现算法必须在不导入外部库的情况下实现但允许使用 numpy、math、sort 相关函数。如果不加以限制直接导某包掉函数就能直接算凸包那还练个锤子知道的小伙伴可以在评论区扣出来
环境推荐Colab
任务1计算多边形面积
给定由 个点构成的平面多边形 计算该多边形的面积。
| input | Output |
| 5 0 0 2 0 2 2 1 1 0 2 | 3 |
任务2多边形坐标
给定的 个构成多边形的点和
个检查点判断每个检查点是否在多边形内。
* 注在边缘线上的点也视作在多边形内。
| input | Output |
| 5 // N points 0 0 // (x1, y1) 2 0 // (x2, y2) 2 2 1 1 0 2 2 0 0 0.5 0.5 -1 -1 | Inside Inside Outside |
读取 input1.txt , input2, input3.txt将结果分别生成到 output1.txt , _output3.txt 。
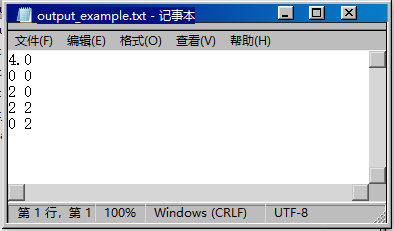
这里的 txt 文件请复制粘贴下面的数据请自行创建
💬 input1.txt
80 27
24 87
66 71
38 31
73 83
8 49
79 89
💬 input2.txt
61 80
14 10
68 11
24 21
20 31
95 90
1 60
14 54
79 47
20 14
59 22
91 13
18 98
51 92
23 30
59 53
82 84
65 28
79 34
1 21
67 82
29 6
13 5
33 58
81 59
0 67
49 47
74 35
5 79
4 76
50 36
85 0
87 66
33 78
78 64
85 11
13 17
61 47
17 92
1 99
30 95
100 18
64 93
68 71
46 76
59 61
31 56
27 52
37 48
85 97
38 88
25 80
19 38
26 6
52 86
25 30
68 43
52 12
97 79
34 63
💬 input3.txt
46 44
15 54
59 6
85 50
59 98
77 92
32 88
99 12
34 37
0 83
88 61
83 69
37 1
24 90
21 100
28 95
67 44
18 33
79 59
80 88
94 94
22 30
89 30
9 83
68 77
45 95
56 100
28 5
31 52
14 49
80 81
95 57
96 28
80 27
87 29
42 52
0 91
9 72
65 78
8 26
40 25
6 30
68 19
54 58
55 53
13 46
30 14
32 45
50 68
85 23
44 100
12 99
14 6
45 93
9 49
55 2
44 93
29 35
9 2
90 85
38 45
33 13
67 89
59 51
6 94
15 48
75 72
7 58
51 49
59 51
输出文件命名为 output1, output2, output3输出结果演示
生成 output 文件后每个 output 都要画出图像这里就不需要大家自己画了
提供了 display.py这是用于生成图像的代码。
def display(input_txt_path, output_txt_path):
import matplotlib.pyplot as plt
'''
input1:input_txt_path=input_example.txt的路径
input2:output_txt_path=output_example.txt的路径
return保存conex_hull图像
'''
with open(input_txt_path, "r") as f:
input_lines = f.readlines()
with open(output_txt_path, "r") as f:
output_lines = f.readlines()
whole_points = input_lines
area = round(float(output_lines[0]), 1)
hull_points = output_lines[1:]
x_list = [int(x.split(" ")[0]) for x in whole_points]
y_list = [int(x.split(" ")[1]) for x in whole_points]
plt.plot(x_list, y_list, marker='.', linestyle='None')
hx_list = [int(x.split(" ")[0]) for x in hull_points]
hy_list = [int(x.split(" ")[1]) for x in hull_points]
plt.plot(hx_list, hy_list, marker='*', linestyle='None', markersize=10)
title = plt.title(f'Area : {area}')
plt.setp(title, color='r')
plt.savefig(output_txt_path[:-3]+"png", bbox_inches='tight')
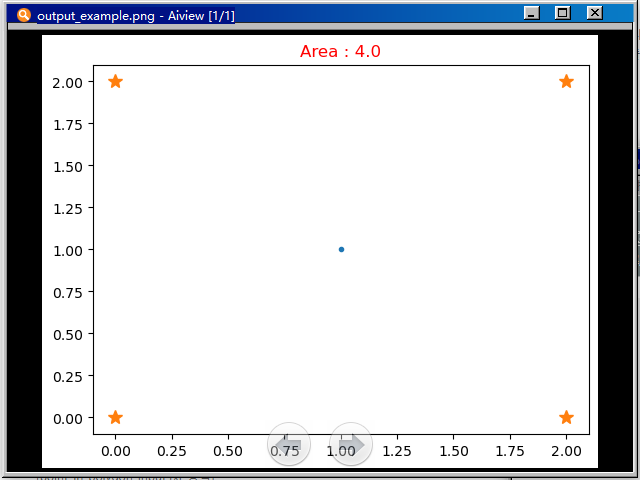
if __name__ == "__main__":
input_txt_path = "./input_example.txt"
output_txt_path = "./output_example.txt"
display(input_txt_path, output_txt_path)通过调用提供的 display 函数生成的图像效果如下
任务3点是否在多边形内
给定 个点构成平面多边形计算凸包及其面积。
| input | Output |
| 5 // N 个点 0 0 // (x1, y1) 2 0 // (x2, y2) 2 2 1 1 0 2 | 4 (0, 0), (2, 0), (2, 2), and (0, 2) are points of convex hull. |
您可以从 point_in_polygon_input.txt 输入 5 个坐标并将它们与在刚才实现的 "练习1" 中保存的output1, output2, output3.txt 的多边形进行比较以 "in" 或 "out" 的形式输入5个坐标。
这里的 point_in_polygon_input.txt 仍然是要自己创建复制粘贴手动创建
point_in_ploygon_input.txt
0 0
1 1
10 10
50 50
70 70
因此与3个 output1-3.txt 的文件相比必须生成 3 个output 文件格式演示如下
参考代码
# -*- coding: utf-8 -*-
import math

def read_points(p):
    L = []
    with open(p, 'r') as FILE:
        line = FILE.readlines()

    Lx, Ly = [int(i.split(" ")[0]) for i in line], [int(i.split(" ")[1]) for i in line]

    cur, sz = 0, len(Lx)
    for cur in range(sz):
        x, y = Lx[cur], Ly[cur]
        L.append(
            (x, y)
        )

    return L

def get_rad(px, py):
    pi = math.pi

    a = px[0] - py[0]
    b = px[1] - py[1]

    if a == 0:
        if b:
            return pi / 2
        else:
            return -1

    rad = math.atan(float(b) / float(a))

    if rad < 0:
        return rad + pi
    else:
        return rad


def sort_points_tan(p, pk):
    L = []
    resL = []

    i = 0
    sz = len(p)
    for i in range(sz):
        L.append({"index": i, "rad": get_rad(p[i], pk)})
    L.sort(key=lambda k: (k.get('rad')))

    sz = len(L)
    for i in range(sz):
        resL.append(p[L[i]["index"]])

    return resL


def calc_area(points):
    sz = len(points)
    points.append(points[0])
    S = 0
    for i in range(sz):
        S += (points[i][0] + points[i + 1][0]) * (points[i + 1][1] - points[i][1])
    return abs(S) / 2


def convex_hull(p):
    p = list(set(p))

    k = 0
    sz = len(p)
    for i in range(1, sz):
        if p[i][1] < p[k][1]:
            k = i
        if (p[i][0] < p[k][0]) and (p[i][1] == p[k][1]):
            k = i

    pk = p[k]
    p.remove(p[k])
    p_sort = sort_points_tan(p, pk)
    L = [pk, p_sort[0]]

    sz = len(p_sort)
    for i in range(1, sz):
        while (( (L[-2][0] - L[-1][0]) * (p_sort[i][1] - L[-1][1]) - (p_sort[i][0] - L[-1][0]) * (L[-2][1] - L[-1][1]) ) > 0):
            L.pop()
        L.append(p_sort[i])

    return L


def check(sp, ep, p):
    if sp[0] < p[0] and ep[1] > p[1]:
        return False
    if sp[1] == p[1] and ep[1] > p[1]:
        return False
    if ep[1] == p[1] and sp[1] > p[1]:
        return False
    if sp[1] == ep[1]:
        return False
    if sp[1] > p[1] and ep[1] > p[1]:
        return False
    if sp[1] < p[1] and ep[1] < p[1]:
        return False
    if ep[0] - (ep[0] - sp[0]) * (ep[1] - p[1]) / (ep[1] - sp[1]) < p[0]:
        return False
    return True


def inpoly(p, poly_points):
    cnt = 0
    i = 0
    sz = len(poly_points)
    for i in range(sz):
        p1, p2 = poly_points[i], poly_points[(i + 1) % sz]
        if check(p1, p2, p):
            cnt += 1

    if cnt % 2 == 1:
        return True
    else:
        return False


def write_in_out(test_points, poly_points, out_txt_path):
    with open(out_txt_path, "w") as FILE:
        i = 0
        for i in test_points:
            if inpoly(i, poly_points):
                FILE.write("in")
            else:
                FILE.write("out")
            FILE.write("\n")
def write_area(poly_points,out_path):
    res = convex_hull(poly_points)

    with open(out_path,"w") as FILE:
        FILE.write(str(calc_area(res)))
        FILE.write('\n')
        sz = len(res)

        for i in range(sz - 1) :
            FILE.write(str( res[i][0]))
            FILE.write(" ")
            FILE.write(str(res[i][1]))
            FILE.write("\n")
    return res


test_points = read_points("point_in_polygon_input.txt")
poly_out_path = "foxny_point_in_polygon_output1.txt" #####
poly_points = read_points("input1.txt")  ####
area = write_area(poly_points, "foxny_output1.txt")  ######
write_in_out(test_points , area, poly_out_path)

def display(input_txt_path, output_txt_path):
    import matplotlib.pyplot as plt

    '''
    input1 : input_txt_path = path of input_example.txt
    input2 : output_txt_path = path of output_example.txt
    return : save convex_hull image
    '''

    with open(input_txt_path, "r") as f:
        input_lines = f.readlines()
    with open(output_txt_path, "r") as f:
        output_lines = f.readlines()

    whole_points = input_lines
    area = round(float(output_lines[0]), 1)
    hull_points = output_lines[1:]

    x_list = [int(x.split(" ")[0]) for x in whole_points]
    y_list = [int(x.split(" ")[1]) for x in whole_points]
    plt.plot(x_list, y_list, marker='.', linestyle='None')

    hx_list = [int(x.split(" ")[0]) for x in hull_points]
    hy_list = [int(x.split(" ")[1]) for x in hull_points]

    plt.plot(hx_list, hy_list, marker='*', linestyle='None', markersize=10)

    title = plt.title(f'Area : {area}')
    plt.setp(title, color='r')
    plt.savefig(output_txt_path[:-3]+"png", bbox_inches='tight')

####################################################################################1
if __name__ == "__main__":
    input_txt_path = "input1.txt"
    output_txt_path = "foxny_output1.txt"
    display(input_txt_path, output_txt_path)

""
🚩 结果演示
foxny_output1.png
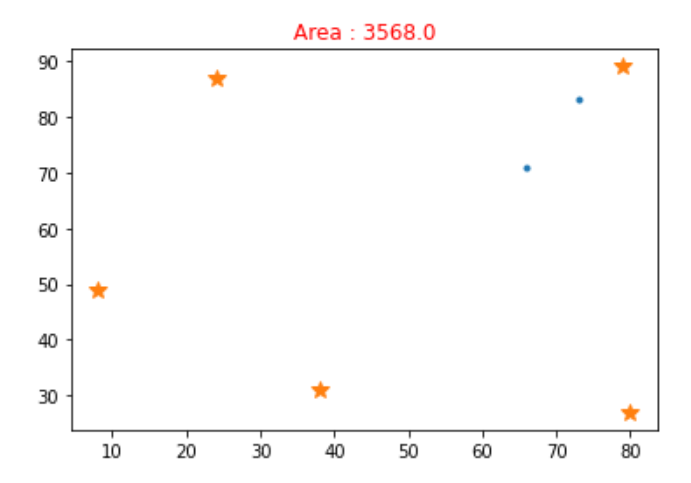
foxny_ouput2.txt
3568.0
80 27
79 89
24 87
8 49
38 31
foxny_output2.png
foxny_output2.txt
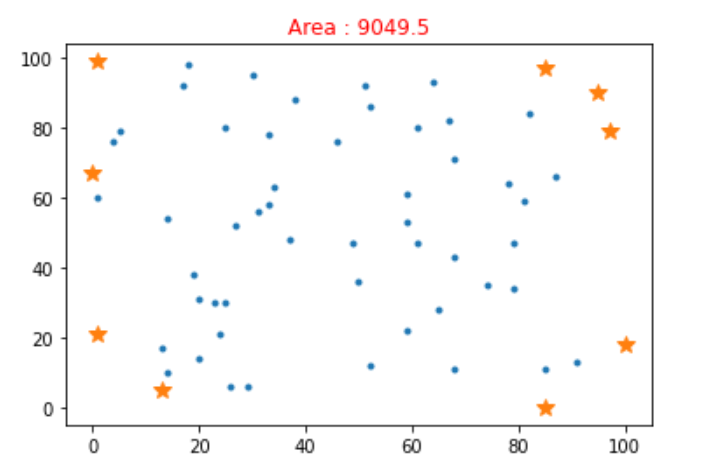
9049.5
85 0
100 18
97 79
95 90
85 97
1 99
0 67
1 21
13 5
foxny_output3.png
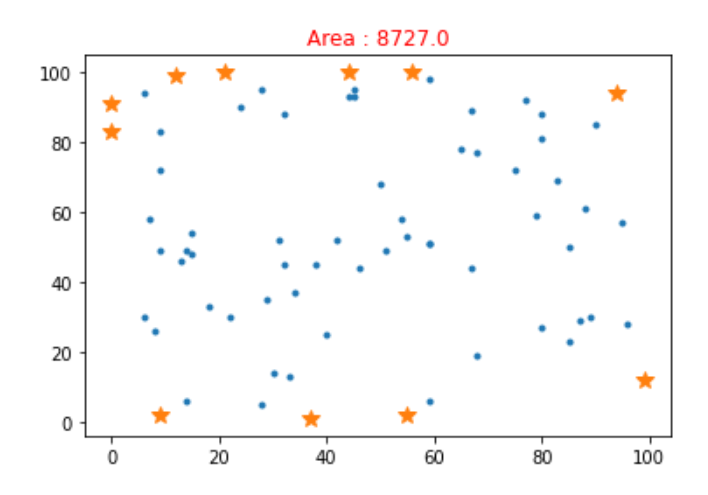
foxny_output3.txt
8727.0
37 1
55 2
99 12
94 94
56 100
21 100
12 99
0 91
0 83
9 2
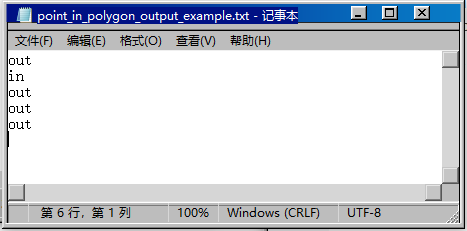
foxny_point_in_polygon_output1.txt
out
out
out
in
in
foxny_point_in_polygon_output2.txt
out
out
in
in
in
foxny_point_in_polygon_output3.txt
out
out
in
in
in

📌 [ 笔者 ]   王亦优
📃 [ 更新 ]   2022.12.12
❌ [ 勘误 ]   /* 暂无 */
📜 [ 声明 ]   由于作者水平有限本文有错误和不准确之处在所难免
本人也很想知道这些错误恳望读者批评指正| 📜 参考资料 Darel Rex Finley. Point-In-Polygon Algorithm — Determining Whether A Point Is Inside A Complex Polygon[EB/OL]. 1998,2006,2007[2022.12.12]. http://alienryderflex.com/polygon/. C++reference[EB/OL]. []. http://www.cplusplus.com/reference/. Microsoft. MSDN(Microsoft Developer Network)[EB/OL]. []. . 百度百科[EB/OL]. []. https://baike.baidu.com/. |