吴恩达《机器学习》——KMeans聚类算法
| 阿里云国内75折 回扣 微信号:monov8 |
| 阿里云国际,腾讯云国际,低至75折。AWS 93折 免费开户实名账号 代冲值 优惠多多 微信号:monov8 飞机:@monov6 |
KMeans聚类算法
数据集、源文件可以在Github项目中获得
链接: https://github.com/Raymond-Yang-2001/AndrewNg-Machine-Learing-Homework
1.无监督学习与KMeans算法
与前文介绍的算法不同本文将介绍的两个算法属于无监督学习算法。无论是线性回归、Logistic回归还是神经网络在训练算法的时候我们的输入均有两个部分组成样本本身以及样本的标签。参数的学习实际上是在样本标签的“指导”下完成的。在无监督学习中这种指导是不存在的。无监督学习算法试图找到数据内部的分布规律并以此来完成某些任务。
在前面的分类例子中数据特征的分布也就是两个坐标的分布存在显而易见的规律。属于同一类的样本彼此的距离更近同一类样本趋向于分布在一起。这里的“距离”实际上是一种相似度的度量KMeans算法就是利用样本之间的相似性对样本进行无监督分类的算法。
2. 算法原理
KMeans聚类是一种基于中心的划分技术具体迭代的计算步骤如下
- 在属性向量空间随机产生 k k k个聚类中心坐标。
- 分别计算数据集 D D D 中的每个数据对象 D i ( 1 ≤ i ≤ n ) D_{i} (1≤i≤n) Di(1≤i≤n)到所有 k k k 个中心的距离度量 D i s t ( i , j ) ( 1 ≤ i ≤ n , 1 ≤ j ≤ k ) Dist(i,j) (1≤i≤n, 1≤j≤k) Dist(i,j)(1≤i≤n,1≤j≤k)并将数据对象 D i D_{i} Di聚到最小距离度量的那一簇中。即 T i ∈ C J T_{i}∈C_{J} Ti∈CJ表示数据对象 D i D_{i} Di 被聚到第 J J J 簇中。其中 J = arg min ( D i s t ( i , j ) ) J=\argmin(Dist(i,j)) J=argmin(Dist(i,j))表示 J J J 为可使得 D i s t ( i , j ) Dist(i,j) Dist(i,j)取最小值的那个 j j j。
- 按照中心的定义计算每一簇的中心坐标形成下一代的 k k k 个中心坐标。
- 如果不满足终结条件转到 2.继续迭代否则结束。
其中簇的形心可以有不同的的定义例如可以是簇内数据对象属性向量的均值也就是重心也可以是中心点等距离度量也可以有不同的定义常用的有欧氏距离、曼哈顿或城市块、街区距离、闵可夫斯基距离等
终止条件可以是以下任何一个
- 没有或最小数目对象被重新分配给不同的聚类。
- 没有或最小数目聚类中心再发生变化。
- 误差平方和局部最小。
用
μ
(
1
)
,
μ
(
2
)
,
⋯
\mu^{(1)},\mu^{(2)},\cdots
μ(1),μ(2),⋯ 来表示聚类中心用
c
(
1
)
,
c
(
2
)
,
⋯
c^{(1)},c^{(2)},\cdots
c(1),c(2),⋯ 来存储与第 i 个实例数据最近的聚
类中心的索引K-均值算法的伪代码如下
Repeat {
for i = 1 to m
ci := index (form 1 to K) of cluster centroid closest to xi

for k = 1 to K
μk := average (mean) of points assigned to cluster k
}
KMeans的目标函数如下所示
J
(
c
(
1
)
,
.
.
.
,
c
(
m
)
,
μ
1
,
.
.
.
,
μ
k
)
=
1
m
∑
i
=
1
m
∣
∣
x
(
i
)
−
μ
c
(
i
)
∣
∣
2
J(c^{(1)},...,c^{(m)},\mu_{1},...,\mu_{k})=\frac{1}{m}\sum_{i=1}^{m}{||x^{(i)}-\mu_{c^{(i)}}||^{2}}
J(c(1),...,c(m),μ1,...,μk)=m1i=1∑m∣∣x(i)−μc(i)∣∣2
优化目标为
min
c
(
1
)
,
.
.
.
,
c
(
m
)
J
(
c
(
1
)
,
.
.
.
,
c
(
m
)
,
μ
1
,
.
.
.
,
μ
k
)
\min_{c^{(1)},...,c^{(m)}}{J(c^{(1)},...,c^{(m)},\mu_{1},...,\mu_{k})}
c(1),...,c(m)minJ(c(1),...,c(m),μ1,...,μk)
第一个循环是用于减小
c
(
i
)
c^{(i)}
c(i)引起的代价而第二个循环则是用于减小
μ
i
\mu_{i}
μi
引起的代价。迭代的过程一定会是每一次迭代都在减小代价函数不然便是出现了错误。
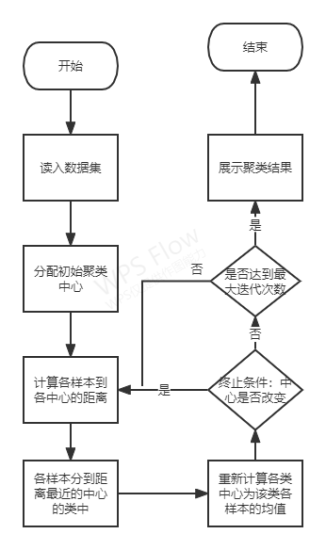
算法框图如下所示
2.1 一种中心点初始化的方案
中心点最简单的初始化方案是在数据范围内进行随机采样大部分情况下这种采样方式能很好地进行分类任务。但是也会出现一些问题
所以这里采用了一种较为复杂的初始化方法
将样本每个维度的特征进行排序并按照排序序列等间隔采样获取中心点。这是基于所有类别的样本在特征空间均匀分布的假设。
3. Python实现
import numpy as np
import matplotlib.pyplot as plt


def visual_result(label_pred, x, centroids, fig_size, fig_dpi):
    """
    Visualization of clustering result (2-dimension sample)
    :param label_pred: (n, )
    :param x:
    :param centroids:
    :param fig_size:
    :param fig_dpi:
    :return:
    """
    k = centroids.shape[0]
    plt.figure(figsize=fig_size, dpi=fig_dpi)
    for i in range(k):
        indices = np.where(label_pred == i)[0]
        cls_i = x[indices, :]
        plt.scatter(cls_i[:, 0], cls_i[:, 1], color=plt.cm.Set1(i % 8), s=10, label='class ' + str(i))
    plt.scatter(x=centroids[:, 0], y=centroids[:, 1], color=plt.cm.Set1(9), marker='*', label='Cluster center')
    plt.legend(loc=2)
    plt.title("Clustering Result")
    plt.show()


def euclid(p1, p2):
    """
    Compute Euclidian distance between p1 and p2
    :param p1: ndarray with shape of (n_samples, n_clusters, n_features)
    :param p2: ndarray with shape of (n_samples, n_clusters, n_features)
    :return: Euclidian distance. ndarray with shape (n_samples, n_clusters)
    """
    # (n,k,d)
    distance = (p1 - p2) ** 2
    # return (n,k)
    return np.sqrt(np.sum(distance, axis=2))


class KMeans:
    """
    KMeans Class
    ---------------------------------------------------------------
    Parameters:
    k:
        Number of clusters to classify.
    max_iter:
        Max iterations of k-means algorithm.

    ---------------------------------------------------------------
    Attributes:
    distance: ndarray with shape of (n_samples, n_clusters)
        The distance between each sample and each centroid.
    centroids: ndarray with shape od (n_clusters, n_features)
    """
    def __init__(self, k, max_iter=1000):
        self.k = k
        self.max_iter = max_iter

        self.distance = None
        self.centroids = None
        self.cls = None
        self.__stop = False

    def __init_centroids(self, x):
        """
        Uniform sampling on each dimension to init centroids
        :param x: (n,d)
        :return:
        """
        idx = np.sort(x, axis=0)
        _k = np.linspace(1, self.k, self.k)
        step = x.shape[0] / (self.k + 1)
        sample_idx = step * _k
        sample_idx = np.floor(sample_idx).astype(int)
        self.centroids = idx[sample_idx, :]

    def __get_distance(self, x):
        """
        x: (n,d) -> (n,k,d)
        centroids (k,d) -> (n,k,d)
        distance (n,k)

        :param x: (n,d)
        :return: (n,k)
        """
        _x = np.expand_dims(x, axis=1).repeat(repeats=self.k, axis=1)
        _c = np.expand_dims(self.centroids, axis=0).repeat(repeats=x.shape[0], axis=0)

        self.distance = euclid(_x, _c)

    def __update_centroids(self, x):
        """
        Compute the average value on each dimension of each sample to for each class to get new centroid
        If the bias of new centroid and current centroids is the same,
        new centroids can be seen as the result
        :param x: ndarray (n,d), samples
        :return:
        """
        new_centroids = self.centroids.copy()
        for i in range(self.k):
            indices = np.where(self.cls == i)[0]
            new_centroids[i, :] = np.average(x[indices, :], axis=0)
        if not np.equal(self.centroids, new_centroids).all():
            self.centroids = new_centroids
        else:
            self.__stop = True

    def __get_closest_centroid(self):
        """
        distance (n,k)
        :return: cls (n,)
        """
        self.cls = np.argmin(self.distance, axis=1)

    def fit(self, x):
        """
        Fit the data
        :param x: ndarray (n,d)
        :return:
        """
        self.__init_centroids(x)
        for i in range(self.max_iter):
            self.__get_distance(x)
            self.__get_closest_centroid()
            if not self.__stop:
                self.__update_centroids(x)
            else:
                break
        if not self.__stop:
            print("KMeans fails to converge, please try larger max_inter.")
        return self.cls, self.centroids
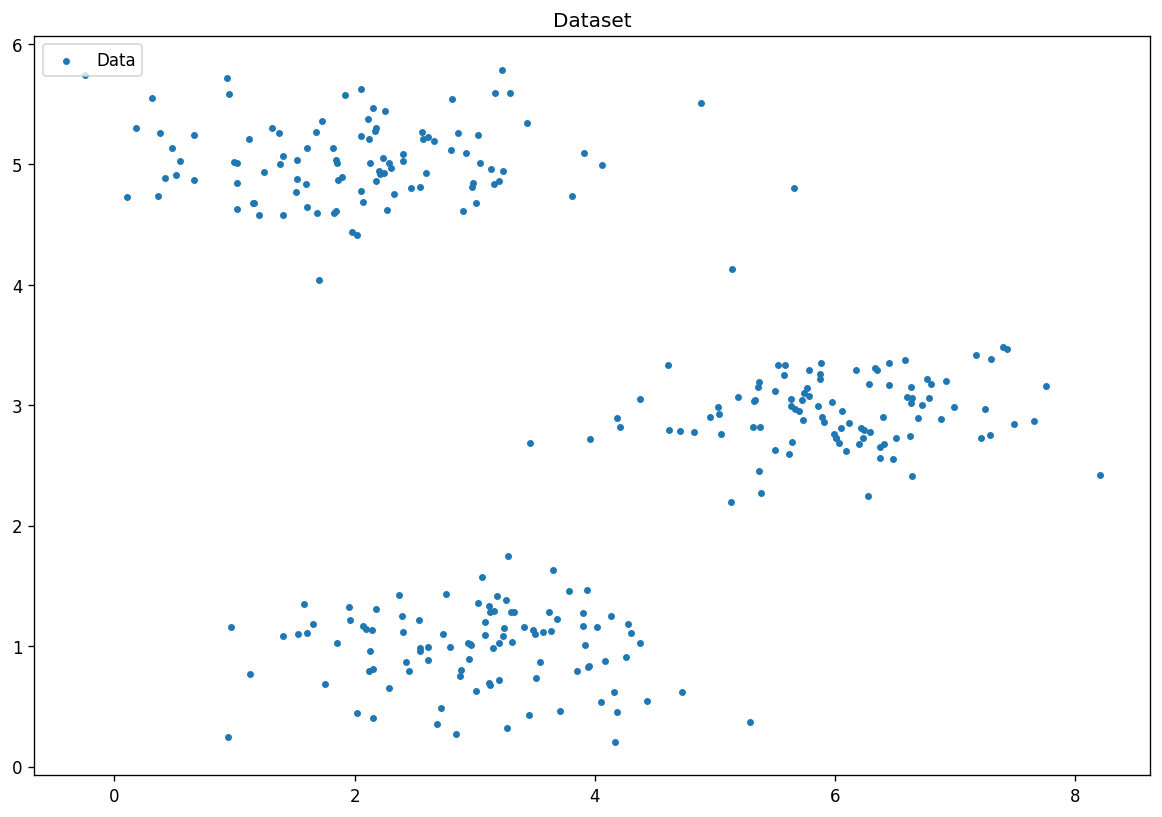
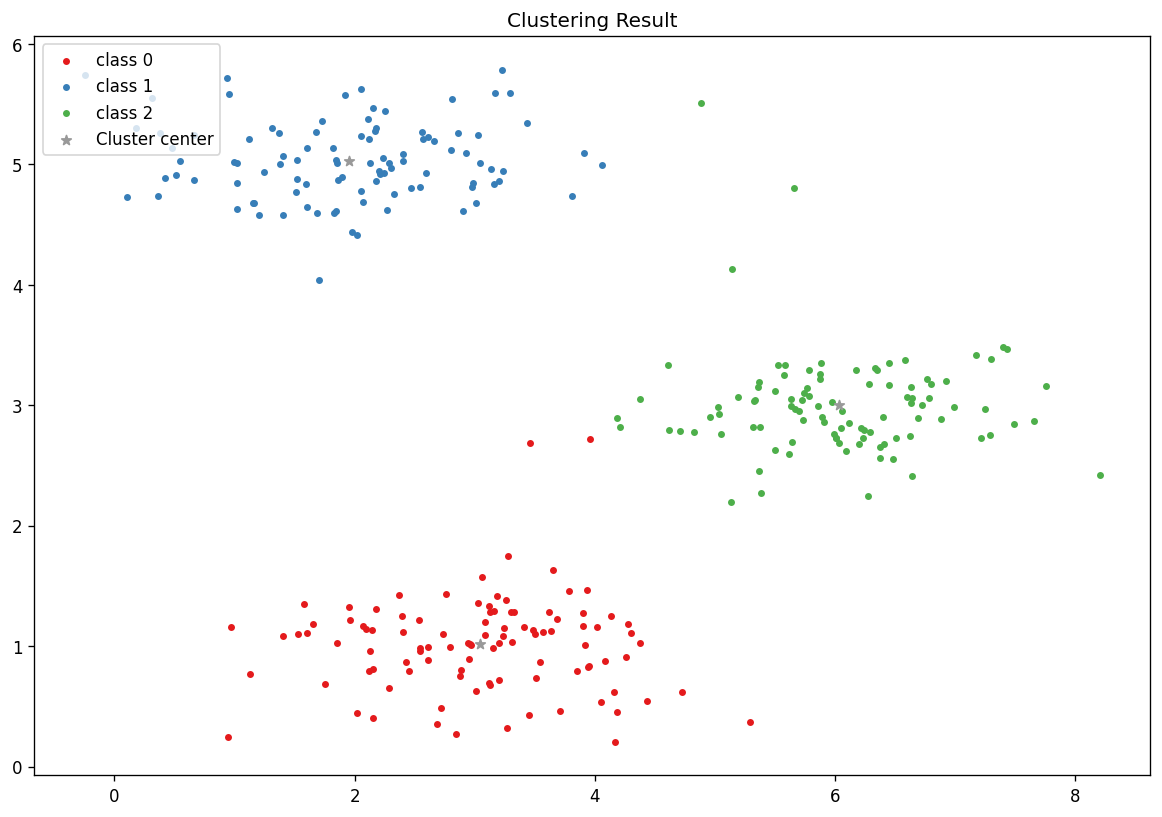
数据集可视化
from KMeans import  KMeans, visual_result
clf = KMeans(k=3,max_iter=1000)
cls, centroids = clf.fit(x)
visual_result(cls,x,centroids,fig_size,fig_dpi)
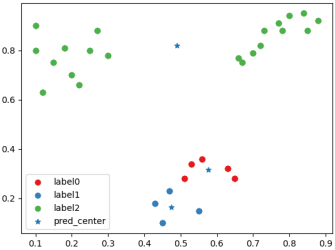
可视化分类结果
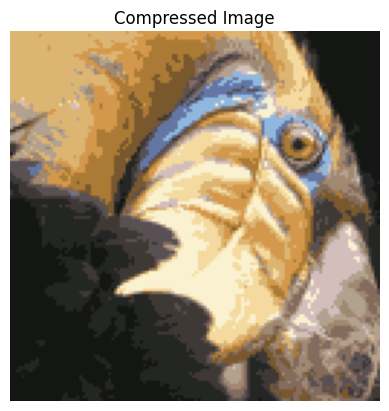
3.1 KMeans实现图像压缩
一副标准的24bit图像由
H
×
W
×
3
H\times W\times3
H×W×3个像素组成每个像素的取值范围是0~255也就是8个bit。一幅128*128的图像占用的空间为
128
×
128
×
3
×
8
=
393216
b
i
t
128\times128\times3\times8=393216\ \rm{bit}
128×128×3×8=393216 bit
如果我们使用16种颜色对原图进行代替那么16种颜色需要
16
×
24
=
384
b
i
t
16\times24=384\ \rm{bit}
16×24=384 bit另外需要标记每一个像素的代替像素的索引需要
128
×
128
×
4
=
65536
b
i
t
128\times128\times4=65536\ \rm{bit}
128×128×4=65536 bit总共需要
384
+
65536
=
65920
b
i
t
384+65536=65920\ \rm{bit}
384+65536=65920 bit。
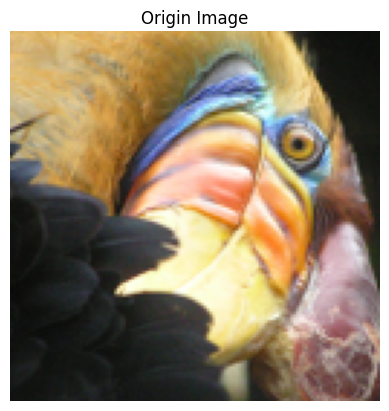
原图展示
对原图进行归一化
image = image / 255
进行聚类恢复展示
clf_image = KMeans(k=16, max_iter=1000)
cls, centroids = clf_image.fit(image_x)
x_recovered = centroids[cls.astype(int),:]
x_recovered = np.reshape(x_recovered,  (image.shape[0], image.shape[1], image.shape[2]))